Table of contents
- Main points
- Things you need to know about this release
- The total trade deficit widened in the three months to October 2018
- Removing the effect of inflation, the trade deficit widened in the three months to October 2018
- The trade in goods deficit narrowed with EU countries and widened with non-EU countries in the three months to October 2018
- Explore UK trade in goods country-by-commodity data via our interactive tools
- The total trade deficit widened in the 12 months to October 2018
- The UK trade in goods deficit narrowed with the EU and widened with non-EU countries in the 12 months to October 2018
- Revisions
- Links to related statistics
- Quality and methodology
1. Main points
The total trade deficit (goods and services) widened £3.1 billion in the three months to October 2018; the goods deficit widened £1.7 billion and the services surplus narrowed £1.3 billion.
The widening in the goods deficit was due mainly to a £3.6 billion increase in imports, as exports rose by a lesser £1.9 billion.
Trade in unspecified goods (including non-monetary gold) and chemicals had the largest widening effect on the goods deficit, which was partially offset by trade in cars in the three months to October 2018.
The trade in goods deficit widened £3.1 billion with non-EU countries and narrowed £1.4 billion with the EU in the three months to October 2018.
Removing the effect of inflation, the total trade deficit widened £3.0 billion in the three months to October 2018.
The total trade deficit widened £5.4 billion in the 12 months to October 2018 due mainly to a £5.1 billion narrowing in the trade in services surplus.
Revisions to the total trade balance from Quarter 1 (Jan to Mar) 2017 to Quarter 3 (July to Sept) 2018 ranged from £0.1 billion to £6.9 billion.
2. Things you need to know about this release
International Passenger Survey
Estimates derived from the International Passenger Survey (IPS) are used to help measure exports and imports of travel services. The IPS has recently transferred data collection from paper forms to tablet computers. Analysis of IPS data has detected no discontinuities as a result of the change in data collection mode, therefore we have replaced forecasts used in recent periods with IPS data within headline trade estimates. Please see our Travel and Tourism release for more information about IPS.
Revision open period
Data in this release have been revised back to January 2017 when compared with trade figures published in our previous trade bulletin on 9 November 2018.
Deflator improvements
We have introduced improvements to some of our goods price deflators within this release that span our revision period, which is open back to January 2017. Improvements incorporate some of the sample work we have been carrying out on the Import Price Index (IPI) and Export Price Index (EPI) first announced in 2016.
We have also completed the first stage of work to increase the number of underlying low level price series that contribute to our deflators, thereby improving the representativeness of price movements. Work to estimate the impact of these improvements has demonstrated these deliver average absolute quarterly revisions to export and import chained volume measures of 0.08% for exports and 0.2% for imports. These changes form part of long-term ongoing work and we plan to complete further improvements in time for Blue Book 2019.
National Statistics designation status
The UK Statistics Authority suspended the National Statistics designation of UK trade (PDF 72.8KB) on 14 November 2014. We have now responded to all of the specific requirements of the reassessment of UK trade and are in the final stages of providing evidence to the Authority. We are undertaking a programme of improvements to UK trade statistics in line with the UK trade development plan, including more detail and improvements now published to address anticipated future demands. On 24 October 2018 we published an article outlining our achievements so far and forward look with regards to the transformation of our trade statistics, we will continue to work with the Office for Statistics Regulation team to regain National Statistics status for UK trade statistics. We welcome feedback on our new trade statistics, developments and future plans. If you have any comments, please email trade@ons.gov.uk.
Back to table of contents3. The total trade deficit widened in the three months to October 2018
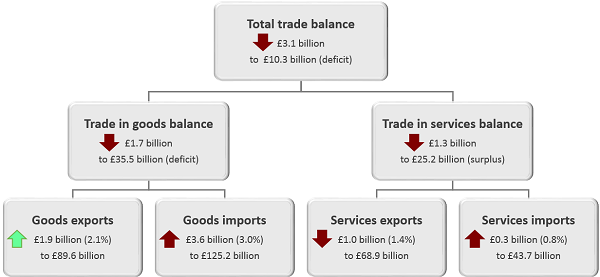
Figure 1 shows the changes to goods, services and total trade balances along with exports and imports in the three months to October 2018 compared with the three months to July 2018.
The total trade deficit (goods and services) widened £3.1 billion to £10.3 billion in the three months to October 2018, as the goods deficit widened and the services surplus narrowed.
The trade in goods deficit widened £1.7 billion in the three months to October 2018, as imports increased £3.6 billion, while exports increased by a lesser £1.9 billion.
Trade in services also contributed to the widening of the total trade deficit, as the services surplus narrowed £1.3 billion, due to a £1.0 billion fall in exports and £0.3 billion increase in imports.
Figure 1: Change in the UK trade balances, exports and imports, three months to October 2018 compared with three months to July 2018
Source: Office for National Statistics
Notes:
The arrow direction indicates whether a component has increased or decreased, while the colour denotes the impact the direction of a movement has on the trade balance.
For example, an increase in imports is denoted by an upward red arrow, as a rise in imports has a negative impact on the trade balance, while an increase in exports is denoted by an upward green arrow, as a rise in exports has a positive impact on the trade balance.
Download this image Figure 1: Change in the UK trade balances, exports and imports, three months to October 2018 compared with three months to July 2018
.png (43.9 kB)
Figure 2 shows the UK trade balance on a three-month on three-month basis between October 2016 and October 2018. The total trade balance widened from the three months to October 2017 to the three months to October 2018, due to the goods deficit widening and services surplus broadly narrowing over the period.
Excluding erratic commodities, the total trade deficit widened £1.1 billion to £9.8 billion in the three months to October 2018.
Figure 2: UK trade balances, three months on three months, October 2016 to October 2018
Source: Office for National Statistics
Download this chart Figure 2: UK trade balances, three months on three months, October 2016 to October 2018
Image .csv .xls4. Removing the effect of inflation, the trade deficit widened in the three months to October 2018
This section presents volume and price estimates of the UK trade balances, exports and imports, using chained volume measures (CVMs) and implied deflators (IDEFs). A CVM is a measure that has had the effect of inflation removed. An IDEF shows the implied change in average prices for the respective components of the trade balance.
Figure 3 shows the UK trade balances on a CVM basis, three-month on three-month from October 2017 to October 2018.
In CVM terms, the total UK trade deficit (goods and services) widened £3.0 billion to £8.9 billion in the three months to October 2018. The widening of the total trade deficit was due to a widening in the trade in goods deficit by £2.5 billion to £33.5 billion. The services surplus narrowed by a lesser £0.5 billion.
Goods exports fell by £0.1 billion, while goods imports rose by £2.4 billion in the three months to October 2018; services exports increased £0.1 billion, while services imports increased £0.5 billion.
The total trade deficit in CVM terms broadly narrowed between the three months to October 2016 and three months to October 2017 before widening between the three months to October 2017 and three months to October 2018.
Figure 3: Total trade balances, chained volume measures, three-months on three-months, October 2016 to October 2018
UK
Source: Office for National Statistics
Download this chart Figure 3: Total trade balances, chained volume measures, three-months on three-months, October 2016 to October 2018
Image .csv .xlsFigure 4 shows the CVM for goods imports along with the accompanying implied deflator. The main factor in the CVM widening of the total trade deficit in the three months to October 2018 was a £2.4 billion increase in goods imports. The largest contributors to the increase in import CVMs were unspecified goods (including non-monetary gold) and cars, which increased by £1.0 billion and £0.6 billion respectively.
Figure 4: Imports of goods, chained volume measures and implied deflator, three-months on three-months, October 2016 to October 2018
UK
Source: Office for National Statistics
Download this chart Figure 4: Imports of goods, chained volume measures and implied deflator, three-months on three-months, October 2016 to October 2018
Image .csv .xls5. The trade in goods deficit narrowed with EU countries and widened with non-EU countries in the three months to October 2018
Figure 5 shows the changes in goods exports, imports and trade balances with EU and non-EU countries between the three months to July 2018 and the three months to October 2018.
The trade in goods deficit widened £3.1 billion with non-EU countries and narrowed £1.4 billion with EU countries in the three months to October 2018.
The main contributor to the widening of the deficit with non-EU countries was a £1.6 billion widening in the balance of unspecified goods (including non-monetary gold); imports increased and exports decreased, both by £0.8 billion.
Imports from non-EU countries increased across a broad range of product groups in the three months to October 2018. The largest contributors to the increase in imports were machinery and transport equipment, and fuels, which increased by £1.6 billion and £1.0 billion respectively.
The increase in imports of fuels from non-EU countries was broadly offset as exports of fuels also increased £0.8 billion in the three months to October 2018. The rise in imports of machinery and transport equipment was also partially offset as exports of machinery and transport equipment increased by £1.0 billion.
The £1.4 billion narrowing in the trade in goods deficit with EU countries was due primarily to a £1.4 billion improvement in the balance of machinery and transport equipment (mainly cars) and a £0.5 billion improvement in the fuels balance, in the three months to October 2018. Exports of fuels rose by £0.3 billion while imports fell £0.2 billion.
Of the £1.4 billion improvement in the machinery and transport balance with EU countries, £0.9 billion was due to cars. Car exports to the EU increased by £0.2 billion while imports fell by £0.7 billion in the three months to October 2018.
As in previous months, trade in cars had a positive impact on both the total trade in goods balance and goods balance with EU countries. Falling imports of cars from EU countries and rising exports to both non-EU and EU countries resulted in cars making a positive contribution of £1.4 billion to the total trade in goods balance. You can now explore these lower-level movements using our trade interactives or country by commodity data for exports and imports, note these data are non-seasonally adjusted.
Figure 5: Changes in UK goods exports, imports and trade balance with EU and non-EU countries, three months to October 2018 compared with three months to July 2018
Source: Office for National Statistics
Download this chart Figure 5: Changes in UK goods exports, imports and trade balance with EU and non-EU countries, three months to October 2018 compared with three months to July 2018
Image .csv .xls6. Explore UK trade in goods country-by-commodity data via our interactive tools
What goods do the UK trade with the rest of the world? Our data break down UK trade in goods with 234 countries by 125 commodities.
Use our map to get a better understanding of UK trade in goods with a particular country. Select a country by hovering over it or using the drop-down menu.
Embed code
For more information about our methods and how we compile these statistics, please see Trade in goods, country-by-commodity experimental data: 2011 to 2016. Users should note that the data published alongside this release are no longer experimental.
What about trade in a particular commodity? What percentage of UK car exports goes to the EU? Where does the UK's imported tea and coffee come from?
Use our interactive tools to understand UK trade of a particular commodity.
Select a commodity from the drop-down menu, or click through the levels to explore the data.
Embed code
Embed code
For more information about our methods and how we compile these statistics, please see Trade in goods, country-by-commodity experimental data: 2011 to 2016. Users should note that the data published alongside this release are no longer experimental.
Back to table of contents7. The total trade deficit widened in the 12 months to October 2018
Figure 6 shows the changes to goods, services and total trade balance along with exports and imports in the 12 months to October 2018, compared with the 12 months to October 2017.
The total UK trade deficit (goods and services) widened £5.4 billion to £29.9 billion in the 12 months to October 2018. The widening of the trade balance was due mainly to a £5.1 billion narrowing in the trade in services surplus; the goods deficit widened by a lesser £0.3 billion.
The narrowing of the services surplus was due to a £5.5 billion increase in services imports in the 12 months to October 2018; exports of services increased £0.4 billion. The largest contributors to the increase in services imports were transport, financial and other business services.
Figure 6: Change to UK trade balances, exports and imports, 12 months to October 2018 compared with 12 months to October 2017

Source: Office for National Statistics
Notes:
The arrow direction indicates whether a component has increased or decreased, while the colour denotes the impact the direction of a movement has on the trade balance.
For example, an increase in imports is denoted by an upward red arrow, as a rise in imports has a negative impact on the trade balance, while an increase in exports is denoted by an upward green arrow, as a rise in exports has a positive impact on the trade balance.
Download this image Figure 6: Change to UK trade balances, exports and imports, 12 months to October 2018 compared with 12 months to October 2017
.png (18.3 kB)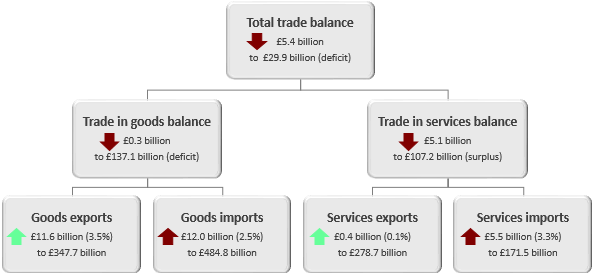
8. The UK trade in goods deficit narrowed with the EU and widened with non-EU countries in the 12 months to October 2018
Figure 7 shows the changes in UK goods exports, imports and trade balances with EU and non-EU countries in the 12 months to October 2018 compared with the 12 months to October 2017.
The UK trade in goods deficit widened £3.2 billion with non-EU countries but narrowed £2.8 billion with EU countries in the 12 months to October 2018.
Exports to EU countries grew by £8.7 billion in the 12 months to October 2018 compared with a £5.9 billion increase in imports. Exports rose by £2.9 billion to non-EU countries while imports increased £6.1 billion.
Figure 7: Changes in UK goods exports, imports and trade balance with EU and non-EU countries, 12 months to October 2018 compared with 12 months to October 2017
Source: Office for National Statistics
Download this chart Figure 7: Changes in UK goods exports, imports and trade balance with EU and non-EU countries, 12 months to October 2018 compared with 12 months to October 2017
Image .csv .xls9. Revisions
Figure 8 shows the revisions to the UK trade balances between Quarter 1 (Jan to Mar) 2017 and Quarter 3 (July to Sept) 2018.
Revisions to the total balance range from an upward revision of £0.1 billion in Quarter 2 (Apr to June) 2017 to a downward revision of £6.9 billion in Quarter 3 2018.
In Quarter 3 2018, the total trade balance was revised downwards by £6.9 billion, due mainly to exports, which were revised down £5.9 billion; imports were revised up by £1.0 billion.
The goods deficit was revised downwards by £3.1 billion in Quarter 3 2018 as exports of goods were revised downwards by £2.0 billion and imports revised upwards by £1.1 billion. A large component of the revision to trade in goods in the most recent quarter was revisions to unspecified goods (including non-monetary gold).
In line with normal practice, the revisions to goods data other than unspecified goods are due to revisions to source data; in the latest quarter, revisions are mainly the result of the inclusion of later returns from business’ in the Intrastat Survey as compared with the estimate provided in the previous trade release.
The services surplus was revised downwards by £3.7 billion in Quarter 3 2018, due primarily to a downward revision of services exports by £3.9 billion; imports were revised down by £0.2 billion.
The revisions to the services data over the period are the result of increased data content; with the inclusion of late returns from international trade in services (ITIS) and other sources as well as the inclusion of International Passenger Survey (IPS) data.
Analysis of IPS data has detected no discontinuities as a result of the change in data collection mode, therefore we have now replaced previous forecasts in recent periods with IPS data within headline trade and other national accounts estimates. Please see our Travel and Tourism release for more information about IPS.
Figure 8: Revisions to UK trade balances, Quarter 1 (Jan to Mar) 2017 to Quarter 3 (July to Sept) 2018
Source: Office for National Statistics
Download this chart Figure 8: Revisions to UK trade balances, Quarter 1 (Jan to Mar) 2017 to Quarter 3 (July to Sept) 2018
Image .csv .xls11. Quality and methodology
Trade is measured through both exports and imports of goods and/or services. Data are supplied by over 30 sources including several administrative sources, HM Revenue and Customs (HMRC) being the largest.
This monthly release contains tables showing the total value of trade in goods together with chained volume measures (CVMs) and implied deflators (IDEFs). Figures are analysed by broad commodity group (CVMs and IDEFs) and according to geographical area (values only). In addition, the UK trade statistical bulletin also includes early monthly estimates of the value of trade in services.
Further qualitative data and information can be found in the attached datasets. This includes data on:
Detailed methodological notes are published in the UK Balance of Payments, The Pink Book 2018.
The UK trade methodology web pages have been developed to provide detailed information about the methods used to produce UK trade statistics.
The UK trade Quality and Methodology Information report contains important information on:
the strengths and limitations of the data and how it compares with related data
uses and users of the data
how the output was created
the quality of the output including the accuracy of the data