Table of contents
- Main points
- Things you need to know about this release
- The total trade deficit narrowed in the three months to July 2018
- Removing the effect of inflation, the trade balance narrowed in the three months to July 2018
- The trade in goods deficit widened with EU countries and narrowed with non-EU countries in the three months to July 2018
- Improvements in the goods and services balances resulted in the trade deficit narrowing in the 12 months to July 2018
- Goods exports and imports increased by more with the EU compared with non-EU countries in the 12 months to July 2018
- Explore UK trade in goods country-by-commodity data via our interactive tools
- Revisions
- Links to related statistics
- Quality and methodology
1. Main points
The total UK trade deficit (goods and services) narrowed £1.4 billion to £3.4 billion in the three months to July 2018.
Removing the effect of inflation, the total trade deficit narrowed £2.0 billion to £2.5 billion in the three months to July 2018.
Excluding erratic commodities (including non-monetary gold), the trade deficit narrowed £0.2 billion to £5.2 billion in the three months to July 2018.
The trade in goods deficit narrowed £1.0 billion with countries outside the EU and widened £0.3 billion with EU countries in the three months to July 2018.
Improvements in the balances of both goods and services in the 12 months to July 2018 resulted in the trade deficit narrowing £13.8 billion to £17.0 billion.
Exports and imports of goods to and from EU countries increased by more than those to and from non-EU countries in the 12 months to July 2018.
Revisions to the total trade balance ranged from an upward revision of £2.7 billion in Quarter 2 (Apr to June) 2018 to a downward revision of £0.4 billion in Quarter 2 (Apr to June) 2017.
2. Things you need to know about this release
International Passenger Survey
Estimates derived from the International Passenger Survey (IPS) are used to help measure exports and imports of travel services. The IPS has recently transferred data collection from paper forms to tablet computers. While initial analysis of the new data found no detectible discontinuities, we are continuing to check the data. Therefore, headline trade and other national accounts estimates will continue to include some forecast data for exports and imports of travel services in the most recent periods. More information is available in the Overseas travel and tourism release.
Data revision policy
All of the data in this release have been revised back to January 2017 when compared with trade figures published in our previous trade bulletin on 10 August 2018.
National Statistics designation status
The UK Statistics Authority suspended the National Statistics designation of UK trade (PDF, 72.8KB) on 14 November 2014. We have now responded to all of the specific requirements of the reassessment of UK trade and are in the final stages of providing evidence to the Authority. We are undertaking a programme of improvements to UK trade statistics in line with the UK trade development plan, including more detail and improvements now published to address anticipated future demands. While delivering against this plan, we will continue to work with the Office for Statistics Regulation team to regain National Statistics status for UK trade statistics. We welcome feedback on this development plan.
Trade figures
Unless otherwise specified, data within this bulletin is in current prices.
Back to table of contents3. The total trade deficit narrowed in the three months to July 2018
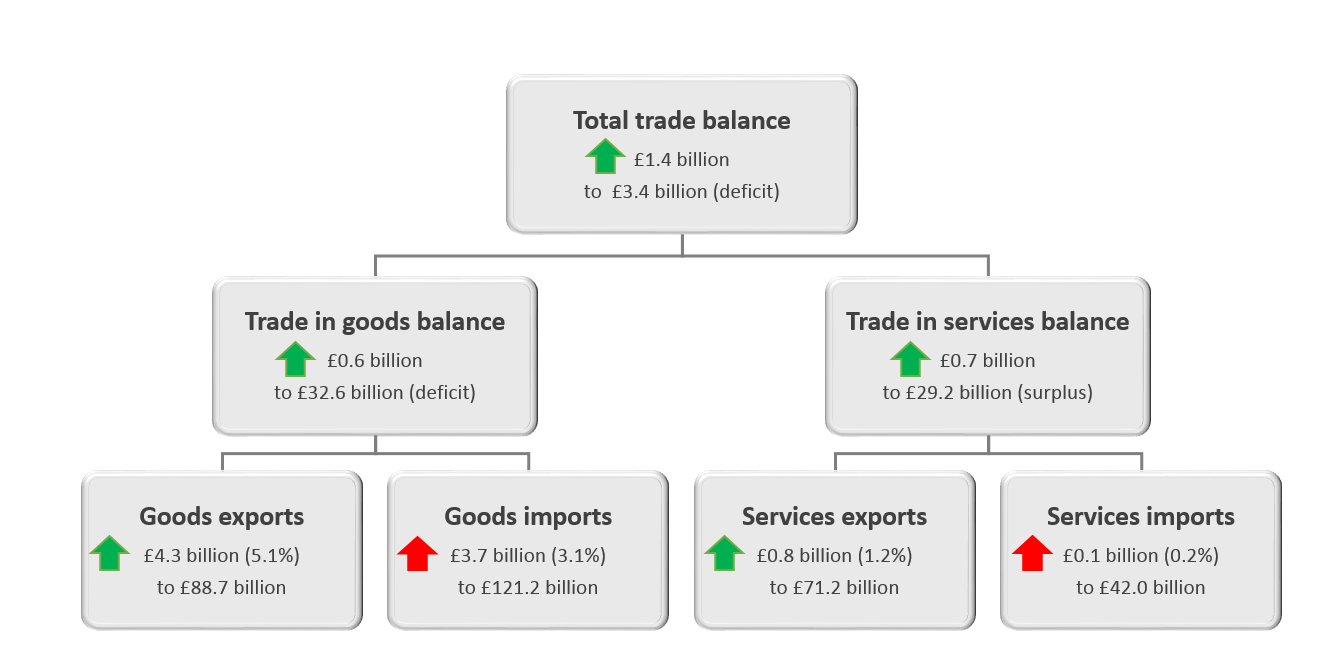
Figure 1 shows the change to goods, services and total trade balances along with exports and imports in the three months to July 2018 compared with the three months to April 2018.
The total UK trade deficit (goods and services) narrowed £1.4 billion to £3.4 billion in the three months to July 2018, as exports of goods and services both increased more than imports.
The trade surplus the UK has in services widened £0.7 billion to £29.2 billion in the three months to July 2018; exports of services increased £0.8 billion, while imports increased by a lesser £0.1 billion.
The trade in goods deficit narrowed £0.6 billion, as goods exports rose £4.3 billion compared with goods imports, which increased £3.7 billion.
Figure 1: Change to UK trade balances, exports and imports, three months to July 2018 compared with three months to April 2018
Source: Office for National Statistics
Notes:
- The arrow direction indicates whether a component has increased or decreased, while the colour denotes the impact the direction of a movement has on the trade balance.
- For example, an increase in imports is denoted by an upward red arrow, as a rise in imports has a negative impact on the trade balance, while an increase in exports is denoted by an upward green arrow, as a rise in exports has a positive impact on the trade balance.
Download this image Figure 1: Change to UK trade balances, exports and imports, three months to July 2018 compared with three months to April 2018
.png (69.1 kB)
Figure 2 shows UK trade balances on a three-month on three-month basis between July 2016 and July 2018. The total trade balance ranged from a deficit of £10.7 billion in the three months to October 2016, to a deficit of £3.4 billion in the three months to July 2018.
Excluding erratic commodities (mainly aircraft and non-monetary gold), the total trade deficit narrowed £0.2 billion in the three months to July 2018.
Figure 2: UK trade balances, three month on three month, July 2016 to July 2018
Source: Office for National Statistics
Download this chart Figure 2: UK trade balances, three month on three month, July 2016 to July 2018
Image .csv .xls4. Removing the effect of inflation, the trade balance narrowed in the three months to July 2018
This section presents volume and price estimates of both the UK trade balances and total exports using chained volume measures (CVMs) and implied deflators (IDEFs). A CVM is a measure that has had the effect of inflation removed. An IDEF shows the implied change in average prices for the respective components of the trade balance.
Figure 3 shows CVMs for the UK trade balances, three-month on three-month, from July 2016 to July 2018. In the three months to July 2018, the total UK trade balance (goods and services) in CVM terms narrowed £2.0 billion to £2.5 billion.
Figure 3: Total trade balances, chained volume measures, three-month on three-month, July 2016 to July 2018
Source: Office for National Statistics
Download this chart Figure 3: Total trade balances, chained volume measures, three-month on three-month, July 2016 to July 2018
Image .csv .xlsFigure 4 shows CVMs and IDEFs for goods exports on a three-month on three-month basis between July 2016 and July 2018.
The narrowing of the total trade deficit in the three months to July 2018 (Figure 3) was due mainly to a £1.8 billion increase in goods exports (Figure 4).
Figure 4: Goods exports, chained volume measure and implied deflator, three-month on three-month, July 2016 to July 2018
Source: Office for National Statistics
Download this chart Figure 4: Goods exports, chained volume measure and implied deflator, three-month on three-month, July 2016 to July 2018
Image .csv .xls5. The trade in goods deficit widened with EU countries and narrowed with non-EU countries in the three months to July 2018
Figure 5 shows the change in goods exports, imports and trade balances with EU and non-EU countries between the three months to July 2018 and the three months to April 2018.
The trade in goods deficit widened £0.3 billion to £23.6 billion with EU countries and narrowed £1.0 billion to £8.9 billion with non-EU countries in the three months to July 2018 (Figure 5).
The widening of the trade in goods deficit with the EU was due to a larger increase in goods imports compared with goods exports in the three months to July 2018; imports increased £1.4 billion, while exports rose by £1.0 billion.
Non-EU exports and imports both increased by more than those to and from the EU in the three months to July 2018; exports to non-EU countries increased £3.3 billion, while imports were up £2.3 billion.
Figure 5: Change in UK goods exports, imports and trade balance with EU and non-EU countries, three months to July 2018 compared with three months to April 2018
Source: Office for National Statistics
Download this chart Figure 5: Change in UK goods exports, imports and trade balance with EU and non-EU countries, three months to July 2018 compared with three months to April 2018
Image .csv .xls6. Improvements in the goods and services balances resulted in the trade deficit narrowing in the 12 months to July 2018
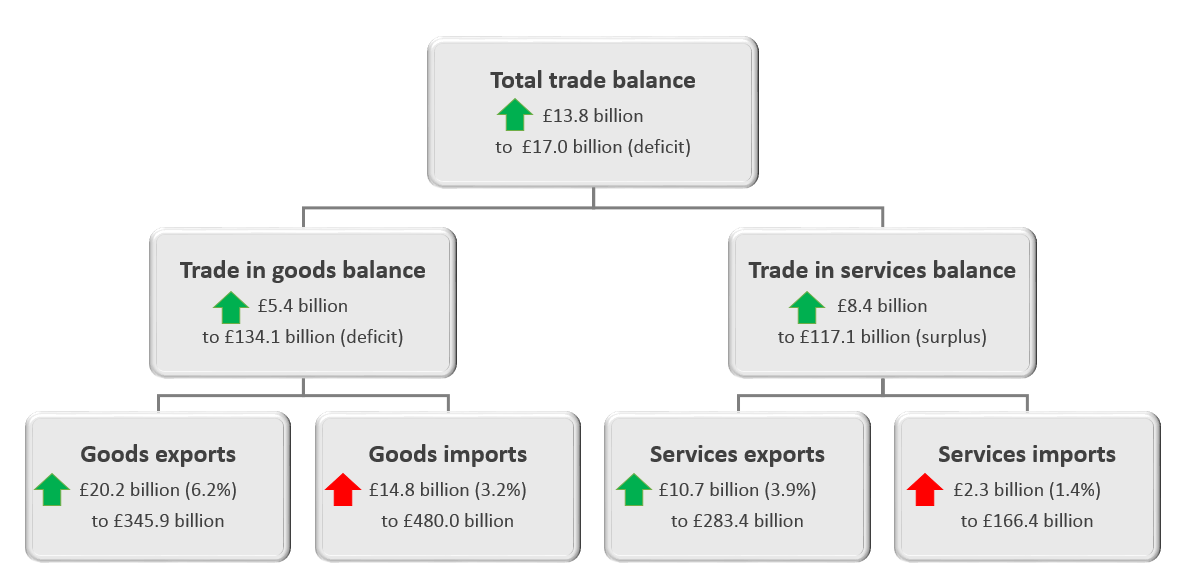
Figure 6 shows the change to goods, services and total trade balances along with exports and imports in the 12 months to July 2018, compared with the 12 months to July 2017.
The total UK trade deficit (goods and services) narrowed £13.8 billion to £17.0 billion in the 12 months to July 2018. The improvement in the balance was driven by exports of goods and services increasing by more than their respective imports.
The main driver was the trade in services surplus, which widened £8.4 billion to £117.1 billion in the 12 months to July 2018; services exports rose £10.7 billion compared with £2.3 billion for imports.
The goods deficit narrowed £5.4 billion to £134.1 billion in the 12 months to July 2018; exports of goods increased £20.2 billion, while imports of goods rose by a lesser £14.8 billion.
Figure 6: Change in UK trade exports, imports and balance, 12-months to July 2018 compared with 12-months to July 2017
Source: Office for National Statistics
Notes:
- The arrow direction indicates whether a component has increased or decreased, while the colour denotes the impact the direction of a movement has on the trade balance.
- For example, an increase in imports is denoted by an upward red arrow, as a rise in imports has a negative impact on the trade balance, while an increase in exports is denoted by an upward green arrow, as a rise in exports has a positive impact on the trade balance.
Download this image Figure 6: Change in UK trade exports, imports and balance, 12-months to July 2018 compared with 12-months to July 2017
.png (65.2 kB)
7. Goods exports and imports increased by more with the EU compared with non-EU countries in the 12 months to July 2018
Figure 7 shows the change in UK goods exports, imports and trade balances with EU and non-EU countries in the 12 months to July 2018 compared with the 12 months to July 2017. The goods deficit with the EU narrowed £2.6 billion compared with a narrowing of £2.7 billion for non-EU countries in the 12 months to July 2018.
Figure 7: Change in UK goods exports, imports and trade balance with EU and non-EU countries, 12 months to July 2018 compared with 12 months to July 2017
Source: Office for National Statistics
Download this chart Figure 7: Change in UK goods exports, imports and trade balance with EU and non-EU countries, 12 months to July 2018 compared with 12 months to July 2017
Image .csv .xlsFigure 8 shows the percentage split of goods exports and imports by countries inside and outside of the EU in the 12 months to July 2018.
Figure 8: UK trade in goods exports and imports percentage split by EU and non-EU countries, 12 months to July 2018
Source: Office for National Statistics
Download this chart Figure 8: UK trade in goods exports and imports percentage split by EU and non-EU countries, 12 months to July 2018
Image .csv .xls8. Explore UK trade in goods country-by-commodity data via our interactive tools
For more information about our methods and how we compile these statistics, please see Trade in goods, country-by-commodity experimental data: 2011 to 2016. Users should note that the data published alongside this release are no longer experimental.
What goods does the UK trade with the rest of the world? Our data breaks down UK trade in goods with 234 countries by 125 commodities.
Use our map to get a better understanding of UK trade in goods with a particular country. Select a country by hovering over it or using the drop-down menu.
Embed code
What about trade in a particular commodity? What percentage of UK car exports goes to the EU? Where does the UK's imported tea and coffee come from?
Use our interactive tools to understand UK trade of a particular commodity.
Select a commodity from the drop-down menu, or click through the levels to explore the data.
UK trade in goods by commodity with the rest of the world, imports and exports, 2012 to 2017
UK exports, 2017
Embed code
Embed code
9. Revisions
Figure 9 shows the revision to imports, exports and total trade from Quarter 1 (Jan to Mar) 2017 to Quarter 2 (Apr to June) 2018. The revisions to the total trade balance range from an upward revision of £2.7 billion in Quarter 2 2018 to a downward revision of £0.4 billion in Quarter 2 2017.
The £2.7 billion upward revision to the total trade balance was comprised of upward revisions of upward revisions of £1.9 billion and £0.7 billion to the goods and services balances respectively.
Figure 9: Revisions to UK Trade balances, Quarter 1 2017 to Quarter 2 2018
Source: Office for National Statistics
Download this chart Figure 9: Revisions to UK Trade balances, Quarter 1 2017 to Quarter 2 2018
Image .csv .xls11. Quality and methodology
Trade is measured through both imports and exports of goods and/or services. Data are supplied by over 30 sources including several administrative sources, HM Revenue and Customs (HMRC) being the largest.
This monthly release contains tables showing the total value of trade in goods together with index numbers of volume and price. Figures are analysed by broad commodity group (values and indices) and according to geographical area (values only). In addition, the UK trade statistical bulletin also includes early monthly estimates of the value of trade in services.
Further qualitative data and information can be found in the attached datasets. This includes data on:
Detailed methodological notes are published in the UK Balance of Payments, The Pink Book 2018.
The UK trade methodology web pages have been developed to provide detailed information about the methods used to produce UK trade statistics.
The UK trade Quality and Methodology Information report contains important information on:
- the strengths and limitations of the data and how it compares with related data
- uses and users of the data
- how the output was created
- the quality of the output including the accuracy of the data