
Table of contents
- Main points
- Things you need to know about this release
- Investment income narrows UK current account deficit
- Fall in exports of goods widens trade deficit
- Increased earnings on investment abroad narrows deficit on primary income
- Secondary income deficit narrows as government payments decrease
- UK net direct investment abroad in 2017 reaches a 10-year high
- International investment position continues to show a net liability to the rest of the world
- Quality and methodology
1. Main points
The UK’s current account deficit was £18.4 billion (3.6% of gross domestic product (GDP)) in Quarter 4 (Oct to Dec) 2017, a narrowing of £0.7 billion from a revised deficit of £19.2 billion (3.7% of GDP) in Quarter 3 (July to Sept) 2017.
This is the narrowest current account deficit as a percentage of GDP since Quarter 1 (Jan to Mar) 2012 when it was 3.1%.
The narrowing in the current account deficit in Quarter 4 2017 was due mostly to a narrowing of the deficits on primary income and secondary income; partially offsetting these was a widening to the deficit on total trade.
The primary income deficit narrowed by £1.8 billion to £6.6 billion in Quarter 4 2017 as UK earnings on investment abroad increased by £1.0 billion and payments to foreign investors decreased by £0.7 billion.
The secondary income deficit narrowed by £1.4 billion to £4.2 billion in Quarter 4 2017 as payments by general government decreased.
The trade in goods deficit widened to £35.7 billion in Quarter 4 2017 with exports decreasing by £1.8 billion and imports increasing by £1.1 billion.
The international investment position shows UK net liabilities of £260.0 billion at the end of Quarter 4 2017.
Annually, the UK’s current account deficit was £82.9 billion (4.1% of GDP) in 2017, a narrowing of £30.7 billion from a deficit of £113.6 billion in 2016; this is the narrowest deficit as a percentage of GDP since 2011 when it was 2.4%.
2. Things you need to know about this release
In accordance with the National Accounts Revisions Policy, the revision period for this release is open from Quarter 1 (Jan to Mar) 2017.
A brief introduction to the UK Balance of Payments (PDF, 92KB) and glossary (PDF, 123KB) provides an overview of the concepts and coverage of the UK Balance of Payments using the Balance of Payments Manual sixth edition.
Further information on the methods are available in the Balance of payments (BoP) Quality and Methodology Information (QMI) report.
Also available is an overview of how movements in foreign exchange rates can impact the balance of payments and international investment position.
Back to table of contents3. Investment income narrows UK current account deficit
In Quarter 4 (Oct to Dec) 2017, the UK current account deficit was £18.4 billion and equates to 3.6% of gross domestic product (GDP) at current market prices. This was a narrowing from a revised deficit of £19.2 billion (3.7% of GDP) in Quarter 3 (July to Sept) 2017 (Figure 1).
The main driver of the reduction to the current account deficit was the primary income account, which narrowed to a deficit of £6.6 billion (or 1.3% of GDP) in Quarter 4 2017, compared with a revised deficit of £8.4 billion (or 1.6% of GDP) in Quarter 3 2017. The narrowing to the deficit on primary income was due to increased earnings from UK investments abroad (see Section 5 for more information).
Figure 1: UK balances as a percentage of gross domestic product
Quarter 1 (Jan to Mar) 2015 to Quarter 4 (Oct to Dec) 2017
Source: Office for National Statistics
Notes:
- Q1 refers to Quarter 1 (Jan to Mar), Q2 refers to Quarter 2 (Apr to June), Q3 refers to Quarter 3 (July to Sept) and Q4 refers to Quarter 4 (Oct to Dec).
Download this chart Figure 1: UK balances as a percentage of gross domestic product
Image .csv .xlsIn addition, the deficit on the secondary income account narrowed by £1.4 billion to £4.2 billion (or 0.8% of GDP), due mostly to a decrease in payments by general government of £1.3 billion (see Section 6 for more information).
Notes for: Investment income narrows UK current account deficit
- Throughout this release Quarter 1 refers to January to March, Quarter 2 refers to April to June, Quarter 3 refers to July to September, and Quarter 4 refers to October to December.
4. Fall in exports of goods widens trade deficit
The total trade deficit widened to £7.6 billion in Quarter 4 (Oct to Dec) 2017, from £5.2 billion in Quarter 3 (July to Sept) 2017. This was due predominantly to the widening of the deficit on trade in goods by £2.9 billion in Quarter 4 2017 to a deficit of £35.7 billion (Figure 2).
Figure 2: UK trade in goods and services balances (seasonally adjusted)
Quarter 1 (Jan to Mar) 2015 to Quarter 4 (Oct to Dec) 2017
Source: Office for National Statistics
Notes:
- Q1 refers to Quarter 1 (Jan to Mar), Q2 refers to Quarter 2 (Apr to June), Q3 refers to Quarter 3 (July to Sept) and Q4 refers to Quarter 4 (Oct to Dec).
Download this chart Figure 2: UK trade in goods and services balances (seasonally adjusted)
Image .csv .xlsThe widening in the trade in goods deficit was due to imports increasing by £1.1 billion, along with a fall in exports of £1.8 billion.
Imports of goods increased to a record £121.5 billion in Quarter 4 2017; of which, imports of oil increased by £0.9 billion, imports of other fuels increased by £0.4 billion and imports of unspecified goods increased by £0.4 billion.
Meanwhile, exports of goods fell by £1.8 billion in Quarter 4 2017 to £85.7 billion. This was due mainly to exports of oil decreasing by £1.3 billion, exports of food, beverages and tobacco decreasing by £0.6 billion and exports of other fuels decreasing by £0.3 billion. These decreases were partially offset by an increase to exports of finished manufactured goods, which increased by £0.4 billion.
While we have no direct evidence, the widening to the trade in goods deficit in oil could be driven partly by the shut-down of the Forties oil pipeline for a large part of December 2017.
The trade in services surplus increased by £0.4 billion to a record £28.1 billion in Quarter 4 2017, this was due to exports increasing by £1.6 billion, partially offset by imports increasing by £1.2 billion.
Exports of services increased to £72.4 billion due to exports of travel increasing by £0.6 billion, exports of insurance and pension services increasing by £0.5 billion and exports of intellectual property increasing by £0.4 billion.
Imports of services increased by £1.2 billion to £44.3 billion in Quarter 4 2017 due to imports of other business services increasing by £0.8 billion and imports of travel increasing by £0.4 billion.
Notes for: Fall in exports of goods widens trade deficit
- Throughout this release Quarter 1 refers to January to March, Quarter 2 refers to April to June, Quarter 3 refers to July to September, and Quarter 4 refers to October to December.
5. Increased earnings on investment abroad narrows deficit on primary income
The primary income deficit narrowed by £1.8 billion in Quarter 4 (Oct to Dec) 2017 to £6.6 billion (Figure 3), with receipts increasing by £1.1 billion and payments decreasing by £0.7 billion.
Figure 3: UK primary income account balances (seasonally adjusted)
Quarter 1 (Jan to Mar) 2015 to Quarter 4 (Oct to Dec) 2017
Source: Office for National Statistics
Notes:
- Q1 refers to Quarter 1 (Jan to Mar), Q2 refers to Quarter 2 (Apr to June), Q3 refers to Quarter 3 (July to Sept) and Q4 refers to Quarter 4 (Oct to Dec).
Download this chart Figure 3: UK primary income account balances (seasonally adjusted)
Image .csv .xlsThe value of earnings on UK foreign direct investment (FDI) abroad (credits) has continued along the upward trend seen since Quarter 1 (Jan to Mar) 2016. Credits rose by £0.5 billion to £23.0 billion in Quarter 4 2017. This is comparable with results last seen in early 2012, as shown in Figure 4.
The value of earnings on inward FDI (debits) has seen a slight decline in the last two quarters of 2017, falling from £16.7 billion in Quarter 2 (Apr to June) 2017 to £15.5 billion in Quarter 4 2017. However, debits remained above £15 billion, this was the first time the value of debits has been above £15 billion in three successive quarters since the beginning of 2008.
Figure 4: Quarterly foreign direct investment earnings (seasonally adjusted)
UK, Quarter 4 (Oct to Dec) 2011 to Quarter 4 (Oct to Dec) 2017
Source: Office for National Statistics
Notes:
- Q1 refers to Quarter 1 (Jan to Mar), Q2 refers to Quarter 2 (Apr to June), Q3 refers to Quarter 3 (July to Sept) and Q4 refers to Quarter 4 (Oct to Dec).
Download this chart Figure 4: Quarterly foreign direct investment earnings (seasonally adjusted)
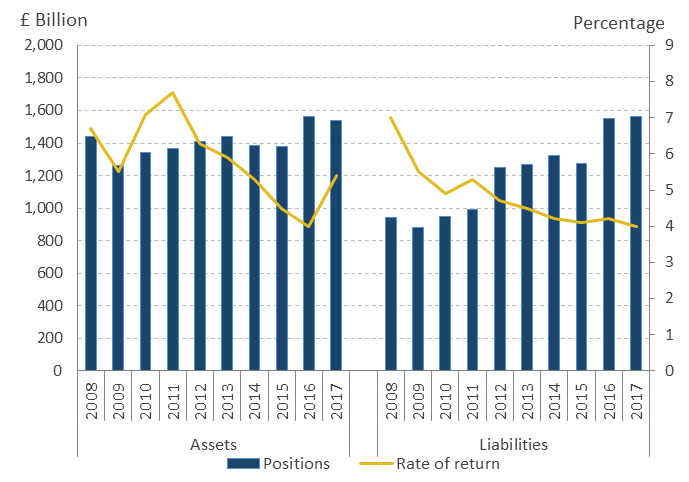
Image .csv .xlsProvisional 2017 estimates showed a notable increase in the implied rate of return on UK FDI assets while that of FDI liabilities remained constant.
The implied rate of return reflects the relationship between the stock of FDI and the earnings on that stock. The stocks of both UK FDI assets (held overseas) had been largely constant prior to 2016. By contrast, the value of UK FDI liabilities (foreign-owned direct investments in the UK) had seen a gradually increasing trend in the same period.
However, FDI assets and liabilities both rose markedly in 2016. Initial estimates for 2017 show that both have remained above 2015 values too. Provisional estimates indicate a net liability FDI position for 2017, for the first time in the time series. The UK’s net FDI position has followed a downward trend since 2008, falling from a net asset position of £494.2 billion to net liability position of £23.8 billion in 2017.
Figure 5: UK direct investment positions and rates of return (not seasonally adjusted) 2008 to 2017
Source: Office for National Statistics
Notes:
- Rates of return are calculated using the income data from Table G and a rolling average of the international investment position from Table K.
Download this image Figure 5: UK direct investment positions and rates of return (not seasonally adjusted) 2008 to 2017
.png (22.3 kB) .xls (37.4 kB)
Notes for: Earnings on investment abroad narrows deficit on primary income
- Throughout this release Quarter 1 refers to January to March, Quarter 2 refers to April to June, Quarter 3 refers to July to September, and Quarter 4 refers to October to December.
6. Secondary income deficit narrows as government payments decrease
The secondary income deficit narrowed in Quarter 4 (Oct to Dec) 2017 to £4.2 billion, from £5.6 billion in Quarter 3 (July to Sept) 2017 (Figure 6). This is the narrowest deficit since Quarter 2 (Apr to June) 2010 when the deficit also rounded to £4.2 billion.
Figure 6: Secondary income account (seasonally adjusted)
UK, Quarter 1 (Jan to Mar) 2015 to Quarter 4 (Oct to Dec) 2017
Source: Office for National Statistics
Notes:
- Q1 refers to Quarter 1 (Jan to Mar), Q2 refers to Quarter 2 (Apr to June), Q3 refers to Quarter 3 (July to Sept) and Q4 refers to Quarter 4 (Oct to Dec).
Download this chart Figure 6: Secondary income account (seasonally adjusted)
Image .csv .xlsThe narrowing was due mainly to government payments decreasing as the European Union adjusted each member state’s contributions in Quarter 4 2017. It should be noted that the quarterly path of net contributions to EU institutions can be erratic and change year-on-year due to the timing of payments and adjustments. The adjustment also featured in Section 3 of the December 2017 Public sector finance bulletin.
Notes for: Secondary income deficit narrows as government payments decrease
- Throughout this release Quarter 1 refers to January to March, Quarter 2 refers to April to June, Quarter 3 refers to July to September, and Quarter 4 refers to October to December.
7. UK net direct investment abroad in 2017 reaches a 10-year high
The total financial account showed a net inflow (that is, more money flowing into the UK) of £24.7 billion in Quarter 4 (Oct to Dec) 2017, compared with a revised net inflow of £11.2 billion in Quarter 3 (July to Sept) 2017 (Figure 7).
Figure 7: UK financial account balances (not seasonally adjusted)
Quarter 1 (Jan to Mar) 2015 to Quarter 4 (Oct to Dec) 2017
Source: Office for National Statistics
Notes:
- Q1 refers to Quarter 1 (Jan to Mar), Q2 refers to Quarter 2 (Apr to June), Q3 refers to Quarter 3 (July to Sept) and Q4 refers to Quarter 4 (Oct to Dec). Total includes reserve assets.
Download this chart Figure 7: UK financial account balances (not seasonally adjusted)
Image .csv .xlsIn 2017, the UK was a net investor abroad in foreign direct investment (FDI) for the first time since 2011, with a net outflow of investment of £65.7 billion. This was due mostly to increased investment overseas by UK residents.
This compares with a net inflow of investment of £161.9 billion in 2016 as foreign investors invested more in the UK than UK residents invested abroad (Figure 8).
The large movements recorded in FDI flows in 2016 and 2017 are attributable mainly to a small number of high-value mergers and acquisitions (M&A) deals, each in excess of £10 billion, completed in those years. More information on M&A can be found in M&A activity in context: 2017 and the M&A involving UK companies: October to December 2017 statistical bulletin.
Figure 8: UK net direct investment flows, (not seasonally adjusted) 2011 to 2017
Source: Office for National Statistics
Download this chart Figure 8: UK net direct investment flows, (not seasonally adjusted) 2011 to 2017
Image .csv .xlsPortfolio investment recorded a net inflow (that is, more money flowing into the UK) of £61.4 billion in Quarter 4 2017, compared with a net inflow of £44.8 billion in Quarter 3 2017. The inflow in Quarter 4 2017 was due mainly to a net flow of investment into the UK of £59.8 billion, with foreign investors investing in UK debt securities (£46.3 billion) and UK equities (£13.5 billion).
Financial derivatives and employee stock options showed net settlement payments of £8.6 billion in Quarter 4 2017, following net settlement receipts of £4.6 billion in Quarter 3 2017.
Other investment in Quarter 4 2017 recorded a net outflow (that is, more money flowing out of the UK) of £45.2 billion, compared with a net inflow (that is, more money flowing into the UK) of £13.6 billion in Quarter 3 2017.
Notes for: UK net direct investment abroad reaches a ten year high
- Throughout this release Quarter 1 refers to January to March, Quarter 2 refers to April to June, Quarter 3 refers to July to September, and Quarter 4 refers to October to December.
8. International investment position continues to show a net liability to the rest of the world
The international investment position (IIP) showed net external liabilities (that is, liabilities exceed assets) of £260.0 billion at the end of Quarter 4 (Oct to Dec) 2017, compared with net external liabilities of £298.9 billion at the end of Quarter 3 (July to Sept) 2017 (Figure 9).
Figure 9: UK international investment position (not seasonally adjusted)
Quarter 1 (Jan to Mar) 2015 to Quarter 4 (Oct to Dec) 2017
Source: Office for National Statistics
Notes:
- Q1 refers to Quarter 1 (Jan to Mar), Q2 refers to Quarter 2 (Apr to June), Q3 refers to Quarter 3 (July to Sept) and Q4 refers to Quarter 4 (Oct to Dec).
Download this chart Figure 9: UK international investment position (not seasonally adjusted)
Image .csv .xlsUK assets rose by £109.9 billion to £10,647.6 billion in Quarter 4 2017. UK external liabilities rose by £71.0 billion in Quarter 4 2017 to £10,907.6 billion.
Figure 10: Total quarterly change in international investment position equity assets broken down into impacts
UK, Quarter 4 (Oct to Dec) 2011 to Quarter 4 (Oct to Dec) 2017
Source: Office for National Statistics
Notes:
- Q1 refers to Quarter 1 (Jan to Mar), Q2 refers to Quarter 2 (Apr to June), Q3 refers to Quarter 3 (July to Sept) and Q4 refers to Quarter 4 (Oct to Dec).
Download this chart Figure 10: Total quarterly change in international investment position equity assets broken down into impacts
Image .csv .xlsFigure 10 presents the positive impact that UK investment in foreign equities had on the net IIP in recent periods. In Quarter 4 2017, UK residents were net investors in foreign equities of £26.2 billion but also benefitted from price effects as buoyant stock markets reached record highs through 2017.
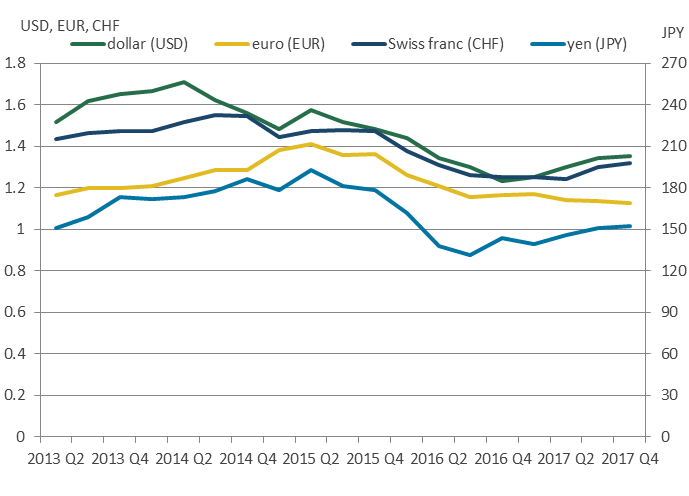
Figure 11: Sterling exchange rates with major trading partners
UK, Quarter 2 (Apr to June) 2013 to Quarter 4 (Oct to Dec) 2017
Source: Office for National Statistics
Notes:
- Q1 refers to Quarter 1 (Jan to Mar), Q2 refers to Quarter 2 (Apr to June), Q3 refers to Quarter 3 (July to Sept) and Q4 refers to Quarter 4 (Oct to Dec).
Download this image Figure 11: Sterling exchange rates with major trading partners
.png (29.6 kB) .xls (46.6 kB)
Figure 11 presents sterling exchange rates against the currencies of major trading partner countries at the close of markets at each quarter end.
At the end of Quarter 4 2017, the sterling exchange rate against a basket of foreign currencies remained virtually unchanged when compared with the end of Quarter 3 2017.
However, when looking at the detail, it continued to appreciate against several major currencies including the US dollar, the Swiss franc and the Japanese yen. Sterling showed a slight depreciation against the euro in Quarter 4 2017 and stands at the lowest rate since Quarter 2 (Apr to June) 2011.
The stock of UK assets and liabilities with the rest of the world can be influenced by movements in exchange rates and price revaluations. On balance, exchange rate movements in Quarter 4 2017 have had less of an impact than the previous year. Table 1 summarises which type of investment is impacted by these changes.
Table 1: Revaluation impacts on investments
| Assets | Liabilities | |||
|---|---|---|---|---|
| Exchange rate movements | Price revaluations | Exchange rate movements | Price revaluations | |
| Direct Investment | Impact | Impact | No impact | Impact |
| Portfolio Investment | ||||
| Equities | Impact | Impact | No impact | Impact |
| Debt Securities | Impact | Impact | No impact | Impact |
| Other Investment | ||||
| Deposits | Impact | No impact | Impact | No impact |
| Loans | Impact | No impact | Impact | No impact |
| Source: Office for National Statistics | ||||
| Notes: | ||||
| 1. Q1 refers to Quarter 1 (Jan to Mar), Q2 refers to Quarter 2 (Apr to June), Q3 refers to Quarter 3 (July to Sept) and Q4 refers to Quarter 4 (Oct to Dec). | ||||
Download this table Table 1: Revaluation impacts on investments
.xls (33.3 kB)Notes for: International investment position
- Throughout this release Quarter 1 refers to January to March, Quarter 2 refers to April to June, Quarter 3 refers to July to September, and Quarter 4 refers to October to December.
9. Quality and methodology
The Balance of payments (BoP) Quality and Methodology Information report contains important information on:
the strengths and limitations of the data and how it compares with related data
uses and users of the data
how the output was created
the quality of the output including the accuracy of the data