Table of contents
- Main points
- Statistician’s comment
- Summary
- Clothing price growth has been trending upwards in 2017
- Energy price growth has been exerting an upward pressure on headline inflation since October 2016
- Rental prices have shown the most growth in London and the South East since 2009, outstripping growth in national average wages
1. Main points
- The 12-month growth rates of consumer prices, and producer input and output prices increased in August 2017, from the rates in July 2017.
- Clothing prices annual growth rate has been trending upwards in 2017 and may reflect exchange rate changes and growth in clothing manufacturers’ input costs.
- Food and energy continue to contribute positively to headline inflation but the difference between core inflation and the headline rate has been narrowing.
- Rental prices have shown the most growth in London and the South East since 2009, outstripping growth in national average wages.
2. Statistician’s comment
Commenting on today’s inflation figures, Head of Inflation Mike Prestwood said:
“Clothing prices rising faster than last year, along with a hike in the cost of petrol, helped nudge inflation upwards. Conversely, these effects were partially offset by airfares, which rose more slowly than during last year’s summer holidays.
“The costs of raw materials and goods leaving factories also increased slightly, mainly due to oil and fuel prices.
“The annual rate of house price growth remained steady in July after slowing throughout the second half of last year, with the East Midlands and East of England growing most strongly.”
Back to table of contents3. Summary
Figure 1 shows the 12-month growth in the Consumer Prices Index including owner occupiers’ housing costs (CPIH) increased to 2.7% in August 2017 up from 2.6% in July 2017. The input Producer Prices Index (input PPI) grew by 7.6% in the 12 months to August 2017, up from 6.2% in the 12 months to July 2017. The output Producer Prices Index (output PPI) grew by 3.4% in the 12 months to August 2017, up from 3.2% in the 12 months to July 2017.
Figure 1: Annual growth rate for Producer Price Index (PPI) input (left-hand side), PPI output and Consumer Prices Index including owner occupiers' housing costs (CPIH) (right-hand side)
UK, August 2008 to August 2017

Source: Office for National Statistics
Notes:
- These data are also available within the Dashboard: Understanding the UK economy.
Download this image Figure 1: Annual growth rate for Producer Price Index (PPI) input (left-hand side), PPI output and Consumer Prices Index including owner occupiers' housing costs (CPIH) (right-hand side)
.png (61.7 kB) .xls (35.8 kB)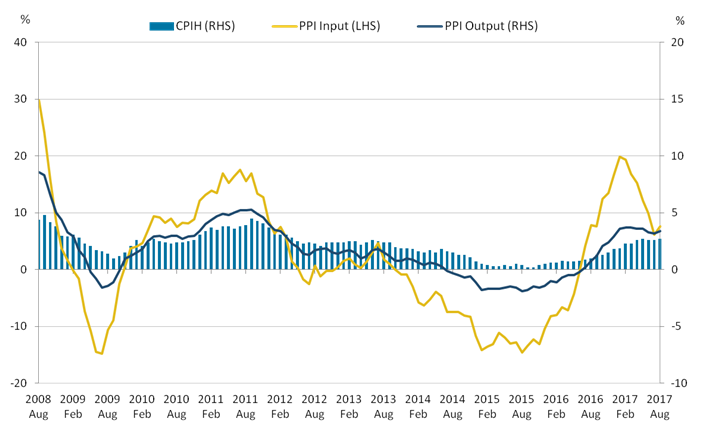
4. Clothing price growth has been trending upwards in 2017
Figure 2 shows 12-month growth rates for imported input prices for UK clothing manufacturers, the inverted sterling effective exchange rate and the growth rate for the clothing component of Consumer Prices Index including owner occupiers’ housing costs (CPIH) from January 2011 to August 2017.
These data illustrate some trends in the exchange rate, PPI imported input costs for clothing and consumer price growth for clothing.
Figure 2: 12-month growth rates for imported products used in the production of wearing apparel (PPI input), CPIH clothing and sterling inverted effective exchange rate (ERI)
UK, January 2011 to August 2017
Source: Office for National Statistics, Bank of England
Download this chart Figure 2: 12-month growth rates for imported products used in the production of wearing apparel (PPI input), CPIH clothing and sterling inverted effective exchange rate (ERI)
Image .csv .xlsThe import costs for clothing manufacturers broadly follow movements in the inverted sterling effective exchange rate, apart from a period in 2011 when imported prices for clothing manufacturers grew, but the effective sterling exchange rate was relatively stable. Since 2012, there has been a close relationship between the two series, including during the recent depreciation of sterling during 2016.
Price growth for clothing bought by consumers has remained relatively flat or negative since 2014, but has been on an upward trend since early 2017. In August, the 12-month growth rate for clothing was 5.1%, the highest since August 2011.
The increase in clothing price inflation may be partly associated with a lagged response to the depreciation of sterling during 2016 as supply contracts with overseas producers may now be renewed on different terms.
Back to table of contents5. Energy price growth has been exerting an upward pressure on headline inflation since October 2016
Figure 3 shows the 12-month growth rates for the main components of CPIH, which are excluded from the core measurement of inflation – namely energy (which comprises a special aggregate of data on gas, electricity and fuel prices, and fuels and lubricants) and all food prices. In addition, non-alcoholic drinks, alcoholic drinks and tobacco are also excluded from the core measure of CPIH.
These data show that energy price growth has mainly been positive apart from a period of deflation between August 2014 and September 2016. Food saw a longer period of deflation between May 2014 and January 2017. The 12-month energy price growth rate increased to 9.1% in February 2017 and has since fallen back as the sterling exchange rate has stabilised. Food price inflation has risen from its low base, turning positive in February 2017. This may be partly due to higher imported costs and other industry-specific factors such as milk shortages.
Figure 3: 12-month growth rates of the energy and food components of CPIH
UK, January 2010 to August 2017
Source: Office for National Statistics
Notes:
- Food is from the Classification of Individual Consumption According to Purpose (COICOP) group 1.1 (Series ID code: L565), and energy is a special aggregate of CPIH components comprising of electricity, gas and other fuels (COICOP 4.5) and fuels and lubricants (COICOP 7.2.2) (Series ID code: L5KY).
Download this chart Figure 3: 12-month growth rates of the energy and food components of CPIH
Image .csv .xlsAs these growth rates are showing different movements in recent months, the effect of excluding these in the measure of “core” CPIH has tended to offset each other, leading to a narrowing of the gap between core CPIH and the headline rate. Figure 4 shows 12-month growth rates for CPIH, core CPIH (which excludes energy, food and non-alcoholic beverages, alcohol and tobacco) and CPIH excluding just food and just energy respectively.
Figure 4: 12-month growth rate CPIH, core CPIH, CPIH excluding food, and CPIH excluding energy
UK, January 2010 to August 2017
Source: Office for National Statistics
Notes:
- CPIH excluding food is calculated by excluding Classification of Individual Consumption According to Purpose (COICOP) group 1.1 and re-chaining the index.
- CPIH excluding energy uses the definition in Figure 3 and is published as a special aggregate (Series ID code: L5LP).
- Core CPIH excludes all of COICOP divisions 1 (food and non-alcoholic drinks) and 2 (alcoholic drinks and tobacco), and COICOP classes 4.5.1 to 4.5.4 (Electricity, gas and other fuels) and 7.2.2 (Fuels and lubricants). It is published as a special aggregate (Series ID code: L5LQ).
Download this chart Figure 4: 12-month growth rate CPIH, core CPIH, CPIH excluding food, and CPIH excluding energy
Image .csv .xlsFigure 4 shows that between 2010 and 2014, the headline rate of CPIH was higher than the core rate of inflation, due largely to the influence of energy prices pushing up the headline measure while food price growth was relatively stable. This trend was reversed during the period of food and energy price deflation around 2014 to 2016. Energy and food prices were generally both pulling down the headline rate of CPIH during this time.
Since January 2017, core CPIH growth has been slower than headline CPIH growth, meaning those elements excluded from the core measure of inflation – particularly food and energy prices – have been pushing up the headline growth rate.
Back to table of contents6. Rental prices have shown the most growth in London and the South East since 2009, outstripping growth in national average wages
Figure 5 shows price indices for headline CPIH, average weekly earnings (AWE) and the Index of Private Housing Rental Prices (IPHRP) for London, the North East, North West and the South East of England. All data are indexed to 2009=100.
Figure 5: Selected private rent price indices by region, average weekly earnings (AWE) for Great Britain and the Consumer Prices Index including owner occupiers’ housing costs (CPIH)
January 2009 to August 2017
Source: Office for National Statistics
Notes:
- The latest AWE data available are for June 2017. AWE data are for Great Britain while CPIH data are for the whole of the UK.
- Private housing rental prices (IPHRP) are only available for England back to 2005.
Download this chart Figure 5: Selected private rent price indices by region, average weekly earnings (AWE) for Great Britain and the Consumer Prices Index including owner occupiers’ housing costs (CPIH)
Image .csv .xlsFigure 5 shows that London and the South East saw the largest fall in rental prices after the downturn. All regions’ rental prices have recovered beyond their respective pre-downturn peaks with London showing the strongest growth trend amongst the selected regions; growing a further 24.2% by August 2017 from its pre-downturn peak in May 2009, after recovering to its pre-downturn peak level in December 2010. In contrast, both the North East and North West have shown consistently weaker trends post-downturn; growing only 4.5% and 6.7% from their pre-downturn peaks in August 2009 and July 2009 respectively. This indicates a strong north-south divide in the growth of rental prices.
Both the North East and North West regions have experienced growth in rental prices below that of the overall basket of goods and services measured by CPIH and AWE over the period since January 2011. It should be noted that CPIH partially captures the trends in house prices and associated rental prices, and thus there is some circularity in this comparison.
Assuming people in these regions have experienced the national increases in AWE, Figure 5 highlights that it has become increasingly difficult to afford to rent a property in southern regions of England. However, weaker growth in the rental prices of northern regions has caused these areas to become increasingly affordable in relation to earnings.
The observable dip in rental prices between August 2009 and November 2011 may be partially explained by lagged changes in the housing market post-downturn. Previous analysis has shown that the dip in rental prices was seen around 14 months later than the dip in house prices. Since then, rental prices in London, for example, have recovered faster than average house prices. Previous analysis of regional differences in house price growth show that it took until April 2012 for average house prices in London to return to their pre-downturn peak, compared with November 2010 for rental prices. This may be related to the availability of private rental properties and greater financial restrictions on mortgages at this time.
Back to table of contents