Table of contents
- Main points
- Statistician’s comment
- Summary
- Producer and consumer prices for oil-related products continue to increase reflecting higher world prices for Brent crude oil
- Core inflation for consumers is still rising steadily although manufacturers’ core input and output inflation have been slowing in 2017
- Food consumer prices and output producer prices are reflecting upward pressure from dairy products
- Cash purchases of properties increased in all regions in advance of stamp duty changes in March 2016 and have since returned to trend
1. Main points
- The 12-month growth rate for consumer prices including owner occupiers’ housing costs has increased to 2.8% in September.
- The 12-month growth in input producer prices has slowed from its recent peak of 19.9% in January 2017, but remains at 8.4% in September 2017.
- Growth in core input and output producer prices (excluding food, energy and tobacco products) have slowed from recent peaks, but growth in core consumer prices continues to rise.
- Dairy and food price increases are contributing relatively strongly to overall producer input and output prices and consumer prices.
- New data on cash and mortgage transactions for purchases of property shows that London has the smallest share of cash purchases at around 25% of all transactions and the South West has the greatest share at around 40%.
2. Statistician’s comment
Commenting on today’s inflation releases, ONS Head of Inflation Mike Prestwood said:
“Food prices and a range of transport costs helped to push up inflation in September. These effects were partly offset by clothing prices that rose less strongly than this time last year.
“While oil and fuel costs continued to rise, overall, the rates of inflation for raw materials and goods leaving factories were little changed in September.
“House price growth edged upwards in the year to August, despite growth in London continuing to ease.”
Back to table of contents3. Summary
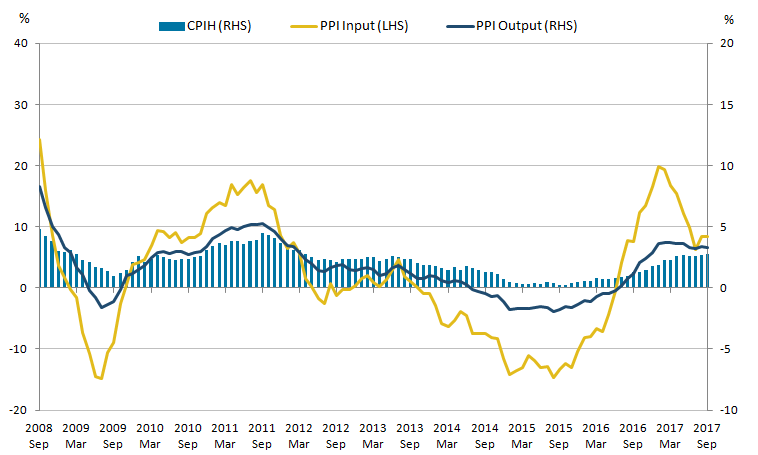
Figure 1 shows the 12-month growth in the Consumer Prices Index including owner occupiers’ housing costs (CPIH) increased to 2.8% in September 2017 up from 2.7% in August. The input Producer Prices Index (input PPI) grew by 8.4% in the 12 months to September 2017, the same as in August and up from 6.3% in the 12 months to July 2017. The output Producer Prices Index (output PPI) grew by 3.3% in the 12 months to September 2017, down from 3.4% in the 12 months to August 2017.
Figure 1: Annual growth rate for Producer Price Index (PPI) input (left-hand side), PPI output and Consumer Prices Index including owner occupiers' housing costs (CPIH) (right-hand side)
UK, September 2008 to September 2017
Source: Office for National Statistics
Notes:
- These data are also available within the Dashboard: Understanding the UK economy.
Download this image Figure 1: Annual growth rate for Producer Price Index (PPI) input (left-hand side), PPI output and Consumer Prices Index including owner occupiers' housing costs (CPIH) (right-hand side)
.png (24.2 kB) .xls (60.9 kB)
Data tables accompanying this commentary include contributions to the 12-month growth rate of output and input PPI, and contributions to the 12-month growth rate of CPIH and CPI by import intensity of goods and services.
Back to table of contents4. Producer and consumer prices for oil-related products continue to increase reflecting higher world prices for Brent crude oil
World prices for Brent crude oil as well as producer and consumer prices are shown in Figure 2. The left-hand panel shows world prices for Brent crude oil, in both pounds sterling and US dollars, and the prices that manufacturing firms pay for crude oil as represented by the crude oil component of the input Producer Prices Index (input PPI). The right-hand panel shows consumer prices for fuels and lubricants from the Consumer Prices Index including owner occupiers’ housing costs (CPIH) and factory gate prices for refined petroleum products from the output Producer Prices Index (output PPI).
Figure 2: Brent crude oil and crude oil (input PPI) index (left-hand side), and refined petroleum products (output PPI) and fuels and lubricants (CPIH) (right-hand side)
UK, January 2015 to September 2017

Source: Office for National Statistics, Financial Times
Download this image Figure 2: Brent crude oil and crude oil (input PPI) index (left-hand side), and refined petroleum products (output PPI) and fuels and lubricants (CPIH) (right-hand side)
.png (36.5 kB) .xls (43.0 kB)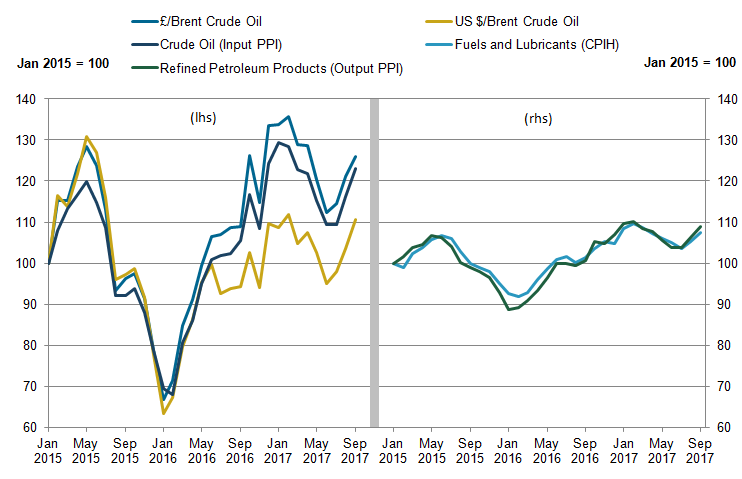
Brent crude oil prices in pounds sterling and US dollars tracked each other closely between January and December 2015 (Figure 2), beginning to diverge in early 2016 and diverging further as pounds sterling depreciated following the EU referendum in June 2016. Although this gap remains, prices have nonetheless continued to follow similar trends with recent price rises following decreases in early 2017.
The latest data for September shows that the crude oil component of input PPI was 23.0% higher than in January 2015. This reflects Brent crude oil prices in pounds sterling which are now 26.0% higher compared with January 2015 whereas US dollar prices have only increased by 10.7% over the same period. All three measures have been increasing consistently since June 2017. Recent increases in world oil prices can be explained, at least in part, by falls in global supplies of oil due to ad-hoc events such as unplanned outages in Libya and the effects of Hurricane Harvey in the US.
These increases in input prices have fed through into higher producer output prices and consumer prices. The right-hand panel of Figure 2 shows the fuels and lubricants component of CPIH and the refined petroleum products component of output PPI. Consumer prices and output prices for petroleum products have followed each other closely over the period. Both series have been rising since mid-2017 with the latest data for September 2017 showing that prices for the fuels and lubricants component of CPIH and the refined petroleum products component of output PPI are now 7.5% and 8.8% higher than in January 2015 respectively, which reflects the trends seen in producer input prices and world prices for oil.
Back to table of contents5. Core inflation for consumers is still rising steadily although manufacturers’ core input and output inflation have been slowing in 2017
Core Producer Prices Index (PPI) inflation excludes food, beverages, tobacco and petroleum (FBTP) components. FBTP industries tend to experience more volatile transitory inflation with growth being prone to temporary shocks that can mask the underlying inflation trend. More discussion on this is available in the Producer Price inflation: August release. Core Consumer Prices Index including owner occupiers’ housing costs (CPIH) excludes energy, food and non-alcoholic beverages, alcoholic beverages and tobacco.
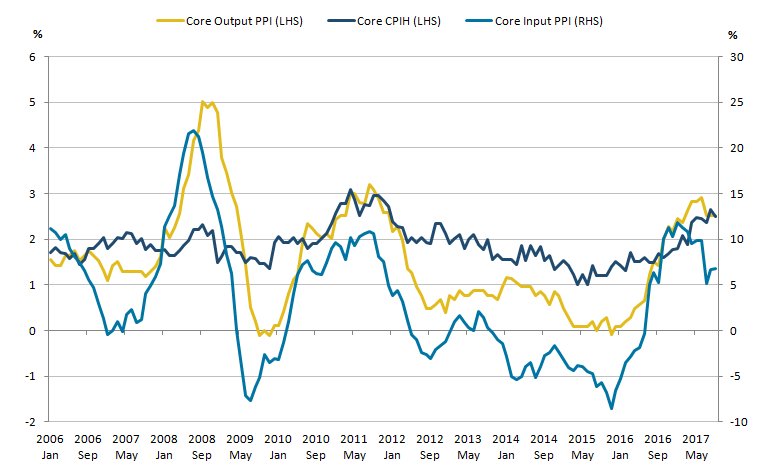
As with the aggregate measures presented in the summary, Figure 3 shows that the core measure of input PPI has tended to be the most volatile measure, with core output PPI following similar but more muted trends at a lag and core CPIH being more stable.
Figure 3: 12-month growth rate for core output Producer Price Index (PPI), core Consumer Prices Index including owner occupiers’ housing costs (CPIH) (left-hand side) and core input PPI (right-hand side)
UK, January 2006 to September 2017
Source: Office for National Statistics
Download this image Figure 3: 12-month growth rate for core output Producer Price Index (PPI), core Consumer Prices Index including owner occupiers’ housing costs (CPIH) (left-hand side) and core input PPI (right-hand side)
.png (34.0 kB) .xls (31.7 kB)
For most of the past five years, the 12-month growth rate in core output PPI has remained between 0.0% and 1.0%. The rate of growth in core output PPI began to increase in November 2015, however, and has remained above 2.0% since November 2016, coinciding with a sharp increase in the 12-month growth rate for core input PPI. This may be one of the factors in the recent increase of core CPIH inflation, which has also risen to be consistently over 2.0% from April 2017.
Previous analysis has suggested that possible causes for the rises in prices for manufacturers since the beginning of 2016 are the increases in global commodity prices and the depreciation of sterling against other major currencies. The recent stabilisation and slowdown in the growth of manufactures’ prices indicate a possible unwinding of the impact of these factors.
Back to table of contents6. Food consumer prices and output producer prices are reflecting upward pressure from dairy products
Figure 4 shows the food components of the Consumer Prices Index including owner occupiers’ housing costs (CPIH) and output Producer Price Index (PPI) for 2016 and 2017 indexed to the January of each year. The food components of both measures have followed different trends in 2017 to those seen in the previous year with prices rising fairly consistently during 2017 compared with deflationary pressures seen in the previous year.
Figure 4: Food components of the Consumer Prices Index including owner occupiers’ housing costs (CPIH) and output Producer Price Index (PPI), 2016 to 2017
UK, January 2016 to September 2017
Source: Office for National Statistics
Download this chart Figure 4: Food components of the Consumer Prices Index including owner occupiers’ housing costs (CPIH) and output Producer Price Index (PPI), 2016 to 2017
Image .csv .xlsIn September 2017, food products provided the largest positive contribution of 0.83 percentage points to the 12-month output PPI growth rate of 3.3%. Growth in the food component of output PPI was predominantly driven by increasing prices for dairy products. Within CPIH, the food component made a positive contribution of 0.08 percentage points to the change in the CPIH 12-month rate with a wide range of food products making an upwards contribution. Previous months’ reports of an increase in butter prices are now becoming evident in the data.
Back to table of contents7. Cash purchases of properties increased in all regions in advance of stamp duty changes in March 2016 and have since returned to trend
The UK House Price Index has for the first time published data on the number of property transactions purchased using either cash or mortgages for Great Britain since January 2012. Figure 5 shows the percentage of cash purchases as a proportion of total sales volumes for England, Scotland and Wales from the start of the series until March 2017. The latest three months of transactions data are excluded from the analysis as there is a lag in the complete data becoming available, and these months are subject to revisions.
Broadly, over time and across all three nations, cash purchases constitute around a third of transactions, with mortgages making up the remaining two-thirds. Figure 5 shows that Wales consistently has a higher proportion of cash purchases compared with England and Scotland. These two nations closely follow each other except for a spike in Scotland in December 2014.
Figure 5: Proportion of cash purchases out of total property transactions for Wales, Scotland and England
January 2012 to March 2017
Source: UK House Price Index, Office for National Statistics
Notes:
- Data for April 2017 to June 2017 are not included due to lags in the complete source data becoming available.
Download this chart Figure 5: Proportion of cash purchases out of total property transactions for Wales, Scotland and England
Image .csv .xlsIn December 2014, the proportion of cash sales in Scotland overtook the proportion of mortgage sales for the first time to reach 52% before returning to trend. This may be due to changes to Stamp Duty Land Tax which came into force on 4 December. The Scottish independence referendum earlier in 2014 may also have influenced cash sales in Scotland. It is possible that those wishing to purchase a property were waiting until the uncertainty caused by the referendum had passed before making major cash purchases.
Figure 6 shows the share of cash purchases for property transactions for selected English regions. The South West consistently has the highest proportion of cash purchases of all English regions, averaging around 40% over the period. Conversely, London consistently has the lowest proportion, averaging around 25% over the period.
Figure 6: Proportion of cash purchases out of total property transactions for selected English regions
January 2012 to March 2017
Source: UK House Price Index, Office for National Statistics
Notes:
- Data for April to June 2017 are not included due to lags in the complete source data becoming available.
Download this chart Figure 6: Proportion of cash purchases out of total property transactions for selected English regions
Image .csv .xlsIn March 2016, there was a spike in cash purchases as a proportion of transactions across all countries and regions of Great Britain. We have previously commented on the peak in total sales volumes at this time. Revised figures reveal that this peak in Great Britain was 136,000 transactions, which is the highest volume of transactions recorded since August 2007. It is likely that this peak reflects demand to purchase a house using cash before new rules on Stamp Duty were introduced from 1 April 2016. These data suggests while both cash and mortgage transactions increased, the change in cash purchases was greater than that of mortgage purchases. After a sharp fall in the share of cash transactions after April 2016, the proportion of cash transactions seems to be broadly returning to trend across each country and region of Great Britain (Figure 5 and 6).
Back to table of contents