Table of contents
1. Main points
Consumer and producer prices
The different timing of Easter in 2016 and 2017 contributed to air fares being the main contributor to the increase in the 12-month rate of the Consumer Prices Index including owner occupiers’ housing costs (CPIH) between March 2017 and April 2017.
Input producer prices rose by 16.6% between April 2016 and April 2017, the third consecutive month of slower annual growth.
The growth rate of services producer prices in Quarter 1 (Jan to Mar) 2017 remains lower than the growth in services prices paid by consumers over the same period.
House prices
- Average house prices in Inner London have fallen in recent months for all property types, including flats.
2. Summary
The rise in the CPIH annual rate was mainly due to increased air fares in April because of the timing of Easter. In addition, rising prices across a range of clothing items also helped push up the annual rate of inflation.
The prices of raw materials and goods leaving factories were little changed on the month as the value of sterling continued to increase.
Annual house price growth continued to slow across the UK but particularly in London.
Figure 1: Annual growth rate for PPI input (LHS), PPI output and CPIH (RHS)
UK, April 2008 to April 2017, %
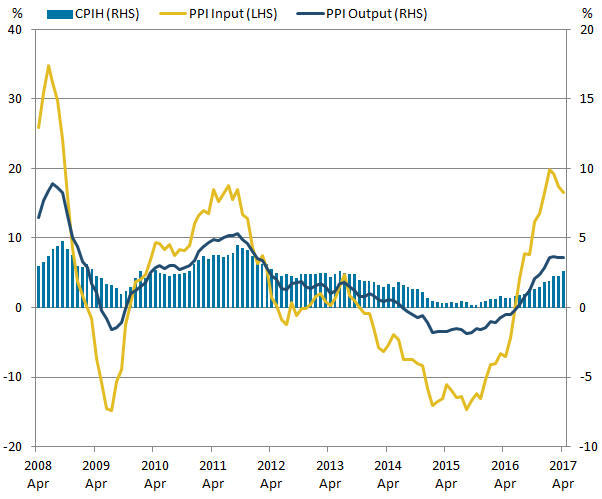
Source: Office for National Statistics
Notes:
- These data are also available within the Dashboard: Understanding the UK economy.
Download this image Figure 1: Annual growth rate for PPI input (LHS), PPI output and CPIH (RHS)
.png (24.3 kB) .xls (29.2 kB)
Figure 1 shows that the 12-month growth in the Consumer Prices Index including owner occupiers’ housing costs (CPIH) was 2.6% in April 2017.
The input Producer Price Index (PPI) increased by 16.6% in the 12 months to April 2017, down from 17.4% in the 12 months to March 2017. The annual growth in input producer prices has been slowing since a peak of 19.9% in January this year. Output producer prices increased by 3.6% in the 12 months to April 2017, unchanged from the growth rate for the 12 months to March 2017. Output producer price inflation has remained stable at around 3.6% to 3.7% since January 2017.
Back to table of contents3. Introduction
We introduced our new economic "theme days" in January 2017, which will ensure that related economic statistics are released together. The separate bulletins relating to the Prices theme day contain details of the new data published and important information on how to interpret the statistics.
UK producer price inflation: Apr 2017
UK consumer price inflation: Apr 2017
Index of private housing rental prices (IPHRP) in Great Britain: Apr 2017
UK house price index: Mar 2017
UK services producer price inflation: Jan to Mar 2017
Data tables accompanying this release are:
contributions to the 12-month growth rate for input and output producer prices
contributions to the 12-month growth rate of the Consumer Prices Index including owner occupiers’ housing costs (CPIH) by import intensity of products
4. Consumer prices
Rising air fares were the main contributor to the increase in the 12-month rate of the Consumer Prices Index including owner occupiers’ housing costs (CPIH) between March 2017 and April 2017. In turn, this is largely due to Easter falling later in 2017 compared with 2016.
Figure 2 explores this “Easter effect” in more detail. It shows the air fares component of CPIH, for the years 2011, 2014, 2016 and 2017, indexed to January=100 for each year. In the chart legend, the month in the bracket indicates which month Easter fell in that particular year. Higher prices seen in air fares around the Easter holidays feed through into the CPIH for March or April, depending on when Easter falls in relation to the air fares collection period1, and tend to be compounded if Easter fell in a different month in the previous year.
The increase seen in April 2017 reflects the timing of Easter this year and is similar to the seasonal uplifts seen in other years when the Easter holiday was in April (for example, 2011 and 2014). In contrast, Figure 2 shows that when the Easter holidays fell in March 2016, the uplift in prices was seen in the March 2016 data. This meant there was a relatively large fall in the price of air fares between March 2016 and April 2016 whereas in 2017, prices rose between March 2017 and April 2017. Overall, this means that air fares had a significant upward contribution to the change in the CPIH 12-month growth rate between March 2017 and April 2017.
Figure 2: Index of passenger transport by air component of CPIH January to June for 2011, 2014, 2016 and 2017
UK
Source: Office for National Statistics
Notes:
- Month in the bracket indicates which month Easter fell in that particular year.
Download this chart Figure 2: Index of passenger transport by air component of CPIH January to June for 2011, 2014, 2016 and 2017
Image .csv .xlsOver the longer term, the trend in passenger air fares is broadly upwards with predictable seasonal variations around the school holidays. Figure 3 shows the index for the passenger transport by air component of CPIH from January 2005 to April 2017, overlaid with three distinct trend lines. Between 2005 and 2008, and since 2014, the trend in the price of passenger air fares has been broadly flat, although volatility in prices has been increasing over the period.
Figure 3: Passenger transport by air component of CPIH
UK, January 2005 to April 2017
Source: Office for National Statistics
Notes:
- A trend line has been added through all the data points in the series. The trend line has been calculated by merging together trend lines for three distinct periods of growth: between January 2005 and December 2007; January 2008 and December 2013; and since January 2014.
Download this chart Figure 3: Passenger transport by air component of CPIH
Image .csv .xlsNotes for: Consumer prices
- In some years, Easter does not fall within the collection period for air fare prices and therefore does not have a significant direct effect on the index, which is why there is not an “Easter effect” every year. The indices are not seasonally adjusted but seasonal effects are typically offset in the annual comparisons.
5. Producer prices
Figure 4 shows that input producer prices have grown by 16.6% between April 2016 and April 2017, the third consecutive month of slower growth. This has coincided with a relative strengthening of the sterling effective exchange rate since October 2016 (shown as a downward movement in the inverted exchange rate 12-month growth rate in Figure 4), which is now around 7.8% lower than in April 2016.
The contribution to input price growth from crude oil remains the largest component of total input price growth, but this has fallen from contributing 9.0 percentage points of 19.3% overall growth in February 2017, to 5.8 percentage points of 16.6% overall growth in the latest month.
Figure 4: Contributions to 12-month growth rate for producer input prices and 12-month growth in the sterling effective exchange rate (inverted)
UK, April 2013 to April 2017
Source: Office for National Statistics, Bank of England
Notes:
- PPI input series "Other imported parts/equipment" and "Other imported materials" have been combined in the chart into "Other imported materials".
Download this chart Figure 4: Contributions to 12-month growth rate for producer input prices and 12-month growth in the sterling effective exchange rate (inverted)
Image .csv .xls6. Services producer prices
While the Services Producer Price Index (SPPI) measures the price received by a company for services they have sold to other businesses and government, the prices paid by households can be estimated by looking at the “all services” special aggregate of the Consumer Prices Index including owner occupiers’ housing costs (CPIH). While it might be expected that the costs associated with providing services to businesses and households will be broadly similar, there are a number of reasons why this may not be the case, for example, the mix of services provided to households may be different to the mix of services provided to other businesses. Figure 5 shows a comparison between the SPPI with the “all services” special aggregate of the CPIH.
Figure 5 shows that in general, inflation in CPIH “all services” runs at a higher rate than the SPPI. During the economic downturn in 2008 to 2009, the annual rates of growth for both indices decreased and then partly increased in 2010. In the latest comparable period, Quarter 1 (Jan to Mar) 2017, the SPPI annual growth was 1.0% while the CPIH “all services” 12-month growth rate was 2.5% over the same period.
Figure 5: Comparison of Services Producer Price Index (SPPI) and “all services” Consumer Prices Index including owner occupiers’ housing costs (CPIH)
UK, Quarter 1 (Jan to Mar) 2006 to Quarter 1 2017
Source: Office for National Statistics
Notes:
SPPI measures changes in the price received by a company or government; CPIH measures changes in the price paid by a consumer. Therefore, CPIH figures may include taxes and fees that are not retained by the service provider.
SPPI measures the price received for services provided by UK based suppliers only, excluding imports from non-UK suppliers. CPIH aims to measure the price paid by consumers in the UK, who may use non-UK based suppliers.
SPPI uses Standard Industrial Classification 2007 (SIC 07) to produce its aggregate, while CPIH uses Classification of Individual Consumption by Purpose (COICOP). This means that the structure of each index may not always correlate at more detailed levels.
Q1 refers to Quarter 1 (Jan to Mar), Q2 refers to Quarter 2 (Apr to Jun), Q3 refers to Quarter 3 (Jul to Sep) and Q4 refers to Quarter 4 (Oct to Dec).
The SPPI data are only available on a quarterly basis. CPIH data are available on a monthly basis but data for CPIH shown in Figure 5 are quarterly averages.
Download this chart Figure 5: Comparison of Services Producer Price Index (SPPI) and “all services” Consumer Prices Index including owner occupiers’ housing costs (CPIH)
Image .csv .xls7. House prices
Figure 6 shows the UK, London and Inner London house price indices indexed to January 2016=100. This shows the price movements of average house prices in these regions compared with the UK as a whole since January 2016.
These data show that while the growth in average house prices in the UK and London tracked each other relatively closely in the first half of 2016, house prices in London have since reduced by around 2% while average prices in the whole of the UK have remained relatively stable.
Figure 6 also shows how average prices of houses in Inner London compare with London as a whole over this period. While in the beginning of 2016, Inner London prices grew more slowly than London as a whole, since the middle of 2016, Inner London house prices have moved broadly in line with London as a whole. Both areas now have average prices that are around 3% higher than in January 2016.
Figure 6: House Price Index (HPI)
UK, London and Inner London, January 2016 to March 2017
Source: Office for National Statistics, Land Registry
Download this chart Figure 6: House Price Index (HPI)
Image .csv .xlsWithin Inner London, Figure 7 shows how average prices have changed since January 2016 by property type.
Figure 7: House Price Index (HPI), Inner London by property type
Inner London, January 2016 to March 2017
Source: Office for National Statistics, Land Registry
Download this chart Figure 7: House Price Index (HPI), Inner London by property type
Image .csv .xlsThese data show that average prices in Inner London for detached, semi-detached and terraced houses grew by around 5% to 6% from January 2016 until September 2016. Since then, prices have fallen back for these types of property but remain around 2% to 3% higher than in January 2016 in the latest period (March 2017). The average price for flats in Inner London has seen more steady growth over the period and is now also around 3% higher than it was in January 2016. The sharpest fall is seen in the latest period, although these estimates could be revised as more data become available in future months1.
Notes for: House prices
- The UK House Price Index (HPI), introduced in 2016, includes all residential properties purchased for market value in the UK. However, as sales only appear in the UK HPI once the purchases have been registered, there can be a delay before transactions feed into the index. As such, caution is advised when interpreting prices changes in the most recent periods as they are liable to be revised. For more information about the UK HPI, please see the main UK house price index bulletin.
Contact details for this Article
Related publications
- Consumer price inflation, UK: April 2017
- Producer price inflation, UK: April 2017
- Services producer price inflation, UK: January to March 2017
- Construction output price indices (OPIs), UK: January to March 2017
- UK House Price Index: March 2017
- Index of Private Housing Rental Prices, Great Britain: April 2017