
Table of contents
- Main points
- Future changes
- What’s changed in this release
- Things you need to know about this release
- Gross fixed capital formation and business investment
- Summary tables
- Revisions to gross fixed capital formation (GFCF) and business investment
- Economic background
- Where to find more of our data
- Adjustments and response rates
- Quality and methodology
- Background notes
1. Main points
Gross fixed capital formation (GFCF), in volume terms, was unchanged at £78.0 billion, in Quarter 4 (Oct to Dec) 2016, when compared with Quarter 3 (July to Sept) 2016.
Between Quarter 3 2016 and Quarter 4 2016, business investment, in volume terms, was estimated to have decreased by 1.0%, from £44.0 billion to £43.5 billion.
Between Quarter 4 2015 and Quarter 4 2016, GFCF was estimated to have increased by 0.9%, from £77.3 billion to £78.0 billion.
Business investment was estimated to have decreased by 0.9% between Quarter 4 2015 and Quarter 4 2016, from £43.9 billion to £43.5 billion.
Between 2015 and 2016, GFCF was estimated to have increased by 0.5%, an increase of £1.4 billion.
Business investment was estimated to have decreased by 1.5% between 2015 and 2016, a decrease of £2.7 billion.
In line with the National Accounts Revisions Policy, the earliest period being revised in this release is Quarter 1 (Jan to Mar) 2016.
2. Future changes
Purchased software
Following a quality review it has been identified that the methodology used to estimate elements of purchased software within gross fixed capital formation (GFCF) has led to some double-counting from 1997 onwards. When this issue is amended in the Blue Book 2017 it will reduce the level of GFCF across the period by around 1.1% per year. The average impact on quarter-on-quarter GFCF growth is negative 0.02% and the average impact on quarter-on-quarter GDP growth is 0.00%.
Blue Book 2017
We have recently published an article, annual improvements to gross fixed capital formation source data for Blue Book 2017. This article was published on 16 February 2017 describing the changes that will be introduced in the September business investment release consistent with Blue Book 2017. The changes include updates to source data and methodology improvements.
Back to table of contents3. What’s changed in this release
This is the first release using the improved gross fixed capital formation (GFCF) estimation system, redeveloped in line with the 5-year strategy for the UK National Accounts, 2015 to 2020 published in July 2015 and recommendations from the Bean Review. This has resulted in some methodological changes to the new GFCF system, including improved deflation and seasonal adjustment methodology.
Further information on the methods changes introduced in the new GFCF estimation system can be found in an article: Changes to the Gross Fixed Capital Formation methodology and processing.
A data impact assessment of the new GFCF system for the periods Quarter 1 (Jan to Mar) 2016 to Quarter 3 (July to Sept) 2016 can be found in an accompanying article: gross fixed capital formation (GFCF) new system deployment and data impact assessment.
Back to table of contents4. Things you need to know about this release
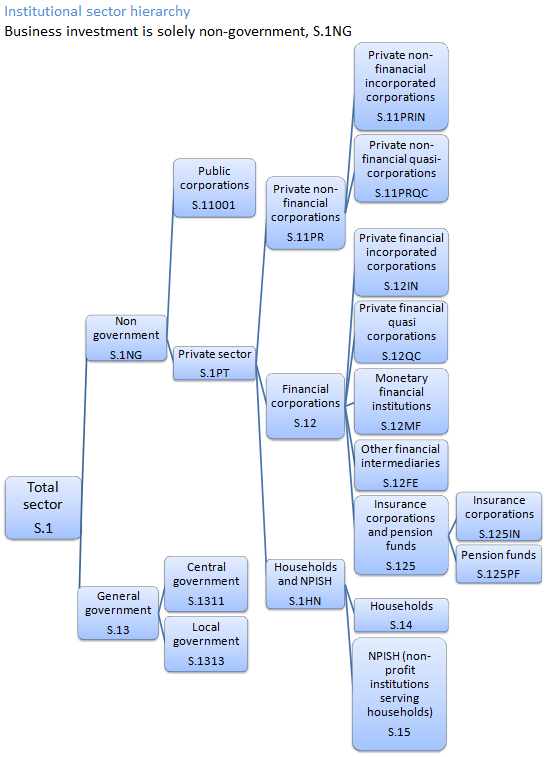
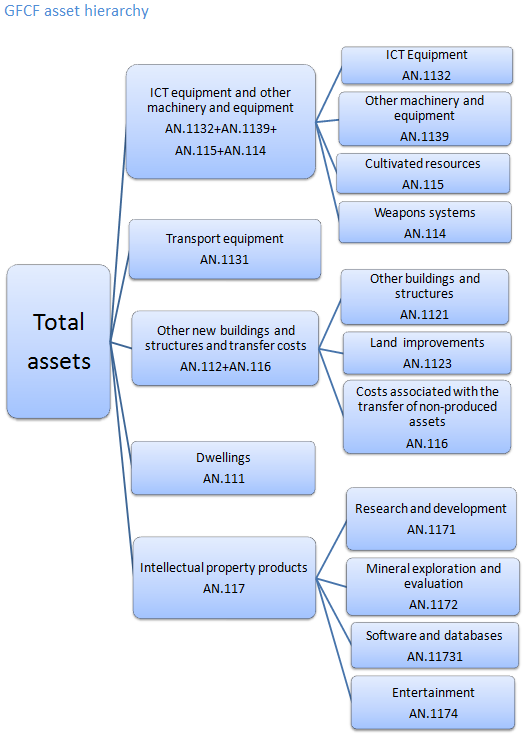
The estimates in this release are short-term indicators of investment in non-financial assets in the UK, such as dwellings, transport equipment, machinery, buildings and intellectual property products. This release covers not only business investment, but asset and sector breakdowns of total gross fixed capital formation (GFCF), of which business investment is one component.
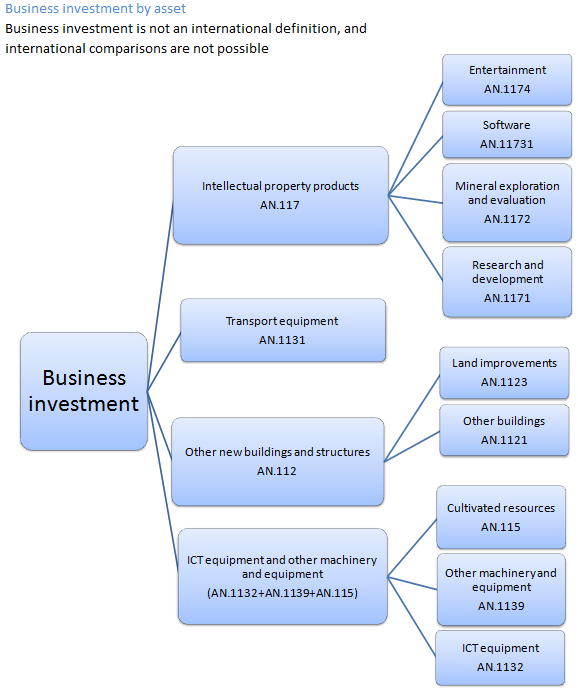
Business investment is net investment by private and public corporations. These include investments in:
transport
information and communication technology (ICT) equipment
other machinery and equipment
cultivated assets
intellectual property products (IPP, which includes investment in software, research and development, artistic originals and mineral exploration)
buildings and other structures
It does not include investment by central or local government, investment in dwellings, or the costs associated with the transfer of non-produced assets (such as land). A full sector and asset hierarchy can be found in the background notes. Business investment is not an internationally recognised concept and therefore it should not be used to make international comparisons.
All investment data referred to in this bulletin are estimates of seasonally adjusted chained volume measures.
Back to table of contents5. Gross fixed capital formation and business investment
Figure 1 shows that the annual level of gross fixed capital formation (GFCF) increased in 2016 to £310.6 billion (0.5%) compared with 2015. This is the smallest increase since 2009 when GFCF fell by 15.2%.
Figure 1: Annual levels of gross fixed capital formation, chained volume measure, 1997 to 2016
Reference year: 2013 Coverage: UK
Source: Office for National Statistics
Download this chart Figure 1: Annual levels of gross fixed capital formation, chained volume measure, 1997 to 2016
Image .csv .xlsFigure 2 shows that in Quarter 4 (Oct to Dec) 2016, GFCF remained at £78.0 billion when compared with Quarter 3 (July to Sept) 2016. Compared with the same quarter a year ago, GFCF increased by £0.7 billion (0.9%) higher than Quarter 4 2015. The increase has been driven by an increase in general government and private sector dwellings, which contributed 0.7 percentage points each to growth.
GFCF is now 1.9% above the pre-economic downturn peak of Quarter 1 (Jan to Mar) 2008 (£76.5 billion).
Figure 2: Quarterly levels of gross fixed capital formation, chained volume measure, seasonally adjusted, Quarter 4 (Oct to Dec) 2008 to Quarter 4 (Oct to Dec) 2016
Reference year: 2013 Coverage: UK
Source: Office for National Statistics
Notes:
Q1 = Quarter 1 (January to March), Q2 = Quarter 2 (April to June), Q3 = Quarter 3 (July to September), Q4 = Quarter 4 (October to December)
The data in this chart covers Quarter 4 (Oct to Dec) 2008 to Quarter 4 2016
Download this chart Figure 2: Quarterly levels of gross fixed capital formation, chained volume measure, seasonally adjusted, Quarter 4 (Oct to Dec) 2008 to Quarter 4 (Oct to Dec) 2016
Image .csv .xlsAs seen in Figure 3, quarterly growth in GFCF in 2016 has been subdued, with 0.0% growth in Quarter 4 2016. This follows an increase of 0.1% in Quarter 1 2016, a fall of 0.2% in Quarter 2 2016 and an increase of 0.3% in Quarter 3 2016.
Figure 3: Quarterly growth of gross fixed capital formation, chained volume measure, seasonally adjusted, Quarter 4 (Oct to Dec) 2008 to Quarter 4 (Oct to Dec) 2016
Reference year: 2013 Coverage: UK
Source: Office for National Statistics
Notes:
Q1 = Quarter 1 (January to March), Q2 = Quarter 2 (April to June), Q3 = Quarter 3 (July to September), Q4 = Quarter 4 (October to December)
The data in this chart covers Quarter 4 2008 to Quarter 4 2016
Download this chart Figure 3: Quarterly growth of gross fixed capital formation, chained volume measure, seasonally adjusted, Quarter 4 (Oct to Dec) 2008 to Quarter 4 (Oct to Dec) 2016
Image .csv .xlsThe annual level of business investment (Figure 4) decreased by 1.5% to £174.5 billion in 2016, when compared with 2015. This is the first annual decrease in business investment since 2009. This decrease is mainly caused by weakness in investment in other buildings and structures and information and communication technology (ICT) equipment and other machinery and equipment.
Figure 4: Annual levels of business investment, chained volume measure, 1997 to 2016
Reference year: 2013 Coverage: UK
Source: Office for National Statistics
Notes:
Q1 = Quarter 1 (January to March), Q2 = Quarter 2 (April to June), Q3 = Quarter 3 (July to September), Q4 = Quarter 4 (October to December)
The data in this chart covers 1997 to 2016
Download this chart Figure 4: Annual levels of business investment, chained volume measure, 1997 to 2016
Image .csv .xlsBusiness investment in Quarter 4 2016 decreased by 1.0% (Figure 5) to £43.5 billion, when compared with the previous quarter. This was mainly due to a decrease in investment in information and communication technology (ICT) equipment and other machinery and equipment and transport equipment. Business investment is now 6.3% above the pre-economic downturn peak of Quarter 1 2008 (£40.9 billion).
Business investment in Quarter 4 2016 decreased by 0.9% (£0.4 billion) when compared with the same quarter a year ago. This marks 4 consecutive periods of negative growth in business investment when compared with the same quarter a year earlier.
Figure 5: Quarterly levels of business investment,chained volume measure, seasonally adjusted, Quarter 4 (Oct to Dec) 2008 to Quarter 4 (Oct to Dec) 2016
Reference year: 2013 Coverage: UK
Source: Office for National Statistics
Notes:
Q1 = Quarter 1 (January to March), Q2 = Quarter 2 (April to June), Q3 = Quarter 3 (July to September), Q4 = Quarter 4 (October to December)
The data in this chart covers Quarter 4 2008 to Quarter 4 2016
Download this chart Figure 5: Quarterly levels of business investment,chained volume measure, seasonally adjusted, Quarter 4 (Oct to Dec) 2008 to Quarter 4 (Oct to Dec) 2016
Image .csv .xlsAs can be seen in F igure 6, business investment in 2016 has seen 2 consecutive quarters of positive growth in Quarter 2 (Apr to June) 2016 (0.6%) and Quarter 3 (July to Sept) 2016 (0.7%) and 2 quarters of more negative growth in Quarter 1 (Jan to Mar) 2016 (1.1%) and Quarter 4 (Oct to Dec) 2016 (1.0%).
Figure 6: Quarterly growth of business investment, chained volume measure, seasonally adjusted, Quarter 4 (Oct to Dec) 2008 to Quarter 4 (Oct to Dec) 2016
Reference year: 2013 Coverage: UK
Source: Office for National Statistics
Notes:
Q1 = Quarter 1 (January to March), Q2 = Quarter 2 (April to June), Q3 = Quarter 3 (July to September), Q4 = Quarter 4 (October to December)
The data in this chart covers Quarter 4 2008 to Quarter 4 2016
Download this chart Figure 6: Quarterly growth of business investment, chained volume measure, seasonally adjusted, Quarter 4 (Oct to Dec) 2008 to Quarter 4 (Oct to Dec) 2016
Image .csv .xls6. Summary tables
Table 1 shows that gross fixed capital formation (GFCF) remained at £78.0 billion in Quarter 4 (Oct to Dec) 2016 when compared with Quarter 3 (July to Sept) 2016. The largest level increase was seen in private sector dwellings, which rose by £0.3 billion (1.8%) to £16.1 billion. Increases were also seen in public corporation dwellings, which increased by £0.1 billion (15.2%) and private sector cost of ownership transfer of non-produced assets, which increased by £0.1 billion (2.2%). The largest decrease came from business investment, which fell by £0.5 billion (1.0%) when compared with Quarter 3 2016.
When compared with the same quarter a year earlier, the largest level increases in Quarter 4 2016 were seen in private sector dwellings, which increased by £0.5 billion (3.3%) and general government, which increased by £0.5 billion (4.4%). The largest decrease came from business investment, which fell by £0.4 billion (0.9%).
Table 1: Total gross fixed capital formation in the UK by institutional sector, Quarter 4 (Oct to Dec) 2016
| % change | % change | £ million | £ million | £ million | |
| Most recent quarter on previous quarter | Most recent quarter on same quarter a year earlier | Most recent level ** | Level change from previous quarter | Level change on same quarter a year earlier | |
| Gross fixed capital formation | 0.0 | 0.9 | 77,961 | -16 | 661 |
| Business investment | -1.0 | -0.9 | 43,496 | -460 | -407 |
| General government | -0.7 | 4.4 | 12,189 | -90 | 519 |
| Public corporations dwellings | 15.2 | 0.7 | 1,043 | 138 | 7 |
| Public corporations cost of ownership transfer on non-produced assets | 8.3 | 3.0 | -169 | -13 | -5 |
| Private sector dwellings | 1.8 | 3.3 | 16,082 | 292 | 520 |
| Private sector cost of ownership transfer on non-produced assets | 2.2 | 0.5 | 5,320 | 117 | 27 |
| Source: Office for National Statistics | |||||
| Notes: | |||||
| 1. ** Series may not sum to totals due to rounding. | |||||
Download this table Table 1: Total gross fixed capital formation in the UK by institutional sector, Quarter 4 (Oct to Dec) 2016
.xls (28.7 kB)Table 2 shows that in asset terms, the largest level increase, quarter-on-quarter, in Quarter 4 2016 was in dwellings, which increased by £0.5 billion (2.7%) to £17.2 billion. Other buildings and structures and transfer costs also saw a level increase of £0.2 billion (0.9%). The largest decrease quarter-on-quarter was seen in information and communication technology (ICT) equipment and other machinery and equipment, which decreased by £0.4 billion (2.6%).
When compared with the same quarter a year earlier, transport equipment saw the largest level increase of £0.7 billion (17.6%). Dwellings also increased quarter on same quarter a year ago, having grown by £0.6 billion (3.4%).
These increases were partially offset by a decrease in information and communication technology (ICT) equipment and other machinery and equipment, which decreased by 2.4% (£0.4 billion). Other buildings and structures and transfer costs also decreased by 1.7% (£0.4 billion).
Table 2: Total gross fixed capital formation in the UK by asset, Quarter 4 (Oct to Dec) 2016
| % change | % change | £ million | £ million | £ million | |
| Most recent quarter on previous quarter | Most recent quarter on same quarter a year earlier | Most recent level ** | Level change from previous quarter | Level change on same quarter a year earlier | |
| Gross fixed capital formation | 0.0 | 0.9 | 77,961 | -16 | 661 |
| Transport equipment | -3.7 | 17.6 | 4,767 | -183 | 713 |
| ICT equipment and other machinery and equipment | -2.6 | -2.4 | 14,427 | -392 | -361 |
| Dwellings | 2.7 | 3.4 | 17,209 | 459 | 561 |
| Other buildings and structures and transfer costs | 0.9 | -1.7 | 24,702 | 218 | -415 |
| Intellectual property products | -0.7 | 1.0 | 16,856 | -118 | 163 |
| Source: Office for National Statistics | |||||
| Notes: | |||||
| 1. ** Series may not sum to totals due to rounding. | |||||
Download this table Table 2: Total gross fixed capital formation in the UK by asset, Quarter 4 (Oct to Dec) 2016
.xls (28.2 kB)7. Revisions to gross fixed capital formation (GFCF) and business investment
Data in this release have been revised from Quarter 1 (Jan to Mar) 2016 to Quarter 3 (July to Sept) 2016 in line with the National Accounts Revisions Policy.
As highlighted in section 3, this is the first release using the new GFCF estimation system, redeveloped in line with the 5-year strategy for the UK National Accounts, 2015 to 2020 published in July 2015 and recommendations from the Bean Review. This has resulted in some methodological changes to the new GFCF system, including improved deflation and seasonal adjustment methodology. A data impact assessment of the new GFCF system can be found in an accompanying article: gross fixed capital formation (GFCF) new system deployment and data impact assessment.
Other reasons for revisions in this release are updated source data and revised seasonal adjustment. Figure 7 shows current GFCF quarterly growth throughout 2016 compared with that published in the Quarter 3 (July to Sept) 2016 revised release.
Figure 7: Quarterly gross fixed capital formation (GFCF) growth compared with previously published GFCF growth, chained volume measure, seasonally adjusted, Quarter 1 (Jan to Mar) 2016 to Quarter 4 (Oct to Dec) 2016
Reference year: 2013 Coverage: UK
Source: Office for National Statistics
Notes:
Q1 = Quarter 1 (January to March), Q2 = Quarter 2 (April to June), Q3 = Quarter 3 (July to September), Q4 = Quarter 4 (October to December)
The data in this chart covers Quarter 4 2008 to Quarter 4 2016
Download this chart Figure 7: Quarterly gross fixed capital formation (GFCF) growth compared with previously published GFCF growth, chained volume measure, seasonally adjusted, Quarter 1 (Jan to Mar) 2016 to Quarter 4 (Oct to Dec) 2016
Image .csv .xlsBusiness investment revisions are shown in Figure 8. The largest revision is in Quarter 2 2016, which has been revised down from 1.2% to 0.6%. This downward revision is mainly due to decreases seen in Quarter 2 2016 in transport equipment and other buildings and structures.
Figure 8: Quarterly business investment growth compared with previously published business investment growth, chained volume measure, seasonally adjusted, Quarter 1 (Jan to Mar) 2016 to Quarter 4 (Oct to Dec) 2016
Reference year: 2013 Coverage: UK
Source: Office for National Statistics
Notes:
Q1 = Quarter 1 (January to March), Q2 = Quarter 2 (April to June), Q3 = Quarter 3 (July to September), Q4 = Quarter 4 (October to December)
The data in this chart covers Quarter 4 2008 to Quarter 4 2016
Download this chart Figure 8: Quarterly business investment growth compared with previously published business investment growth, chained volume measure, seasonally adjusted, Quarter 1 (Jan to Mar) 2016 to Quarter 4 (Oct to Dec) 2016
Image .csv .xls8. Economic background
Gross fixed capital formation (GFCF) is provisionally estimated to have grown by 0.9% between Quarter 4 (Oct to Dec) 2015 and Quarter 4 2016, following a broadly unchanged year from Quarter 3 (July to Sept) 2015 to Quarter 3 2016. For the calendar year of 2016, GFCF was estimated to have grown by 0.5%, the lowest rate of growth for a calendar year since 2009. Total GFCF growth has been consistently slowing since 2014. Quarter on same quarter a year ago growth averaged 6.8% in 2014; fell to 3.5% in 2015 then fell further to 0.5% for 2016. Quarter-on-quarter growth for GFCF remained broadly unchanged also, with no change being seen from Quarter 3 2016 to Quarter 4 2016.
On a sector basis, the increase in GFCF quarter on same quarter a year ago was mainly driven by general government and investment in private sector dwellings; each contributed 0.7 percentage points to overall growth. This was partially offset by a fall in business investment in the same period, which contributed negative 0.5 percentage points. Business investment is estimated to have fallen by 1.0% between Quarter 3 2016 and Quarter 4 2016. An important factor to consider when looking at business investment is the availability or supply of credit. In the most recent Bank of England Credit Conditions Review, the supply of lending to firms was found to have remained above normal levels. However, survey data suggested that corporate demand for credit continued to soften, mirroring a trend seen in Quarter 3 2016.
On an asset basis, the quarter on same quarter a year ago increase in GFCF was mainly driven by transport equipment and dwellings, which contributed 0.9 and 0.7 percentage points to growth respectively. Other buildings, structures and transfer costs contributed negative 0.5 percentage points to growth, as did ICT equipment and other machinery and equipment.
Quarter 4 2016 marks 2 full quarters since the UK voted to leave the European Union. The Bank of England has upgraded its forecasts for business investment and gross domestic product (GDP) in light of stronger than expected economic performance since the result. The Monetary Policy Committee (MPC) cites one of the main reasons for this as the increased confidence in the global economy in the immediate future (particularly in the United States). However, the MPC does predict business investment to be lower in 3 years time than the projected level prior to the referendum.
Developments in the housing market can also be an important indicator of investment and wider activity in the economy. The construction sector grew by 0.2% in Quarter 4 2016 when compared with Quarter 3 2016, contributing to annual growth of 1.5% in 2016 (Construction output in Great Britain: Dec 2016 and Oct to Dec 2016). This is mainly driven by an increase in new housing work. Average house prices in the UK have increased by 7.2% in the year to December 2016, continuing the strong growth seen since the end of 2013. However, annual growth has been weaker in the second half of 2016 compared with the first half of the year.
Back to table of contents9. Where to find more of our data
We also publish additional analyses of GFCF, business investment and the Quarterly Acquisitions and Disposals of Capital Assets Survey, which have been created in response to user requests. For enquiries about user-requested data email gcf@ons.gov.uk.
Back to table of contents10. Adjustments and response rates
Adjustments
Large capital expenditure tends to be reported later in the data collection period than smaller capital expenditure. This means that larger expenditures are often included in the revised (month 3) results, but are not reported in time for the provisional (month 2) results, leading to a tendency towards upwards revisions in the later estimates for business investment and gross fixed capital formation (GFCF). Following investigation of the impact of this effect, from Quarter 3 (July to Sept) 2013, in the revised estimate a bias adjustment was introduced to GFCF and its components.
A bias adjustment of £0.8 billion has been included in the provisional (month 2) release for Quarter 4 (Oct to Dec) 2016. This adjustment will be reassessed in line with previous revisions and will be updated when Quarter 4 2016 is next revised in the Quarter 4 2016 revised release.
In order to try and improve the quality of the response from our data suppliers, clearer instructions were added to the Quarterly Survey of Capital Expenditure. These updates are outlined in the provisional Quarter 1 (Jan to Mar) 2015 Business investment release. Feedback from some respondents indicated that they had been misreporting their asset breakdown and were correcting this on the new questionnaire. We found that some respondents were reporting new construction work as other capital equipment (OCE). From Quarter 1 2015, respondents to the survey are now reporting more in new construction work at the expense of other capital equipment. To remain consistent with the previous data, we have made some adjustments to the assets in the current price series in Quarter 1 2015 to Quarter 4 2016. These adjustments are shown in Table 3.
Table 3: Adjustments made to buildings and other machinery to account for improved survey information, Quarter 1 (Jan to Mar) 2015 to Quarter 4 (Oct to Dec) 2016, UK
| Period | Adjustment to buildings (£ billion) | Adjustment to machinery (£ billion) |
| Q1 2015 | -1.5 | 1.5 |
| Q2 2015 | -2.1 | 2.1 |
| Q3 2015 | -1.9 | 1.9 |
| Q4 2015 | -1.9 | 1.9 |
| Q1 2016 | -1.9 | 1.9 |
| Q2 2016 | -1.9 | 1.9 |
| Q3 2016 | -2.1 | 2.1 |
| Q4 2016 | -2.2 | 2.2 |
| Source: Office for National Statistics | ||
| Notes: | ||
| 1. Q1 is Quarter 1 (Jan to Mar) | ||
| 2. Q2 is Quarter 2 (Apr to June) | ||
| 3. Q3 is Quarter 3 (July to Sept) | ||
| 4. Q4 is Quarter 4 (Oct to Dec) | ||
Download this table Table 3: Adjustments made to buildings and other machinery to account for improved survey information, Quarter 1 (Jan to Mar) 2015 to Quarter 4 (Oct to Dec) 2016, UK
.xls (27.6 kB)Survey response rates
Table 4 presents the provisional (month 2) and revised (month 3) response rates for the Quarterly Acquisitions and Disposals of Capital Assets Survey (QCAS). The estimates in this release are based on the Quarter 4 2016 month 2 (provisional) survey results.
Table 4: UK response rates for quarterly acquisitions and disposals of capital assets survey at time of publication, Quarter 4 (Oct to Dec) 2015 to Quarter 4 (Oct to Dec) 2016
| At month 2 (provisional) | At month 3 (revised) | ||||||
| Period | Survey response rates / % | Period | Survey response rates / % | ||||
| 2015 | Q4 | 68.6 | 2015 | Q4 | 89.8 | ||
| 2016 | Q1 | 69.2 | 2016 | Q1 | 89.4 | ||
| Q2 | 71.4 | Q2 | 89.1 | ||||
| Q3 | 72.8 | Q3 | 83.5 | ||||
| Q4 | 68.5 | ||||||
| Source: Office for National Statistics | |||||||
| Notes: | |||||||
| 1. Q1 is Quarter 1 (Jan to Mar) | |||||||
| 2. Q2 is Quarter 2 (Apr to June) | |||||||
| 3. Q3 is Quarter 3 (July to Sept) | |||||||
| 4. Q4 is Quarter 4 (Oct to Dec) | |||||||
Download this table Table 4: UK response rates for quarterly acquisitions and disposals of capital assets survey at time of publication, Quarter 4 (Oct to Dec) 2015 to Quarter 4 (Oct to Dec) 2016
.xls (26.1 kB)11. Quality and methodology
The Business investment Quality and Methodology Information document contains important information on:
the strengths and limitations of the data
the quality of the output, including the accuracy of the data and how it compares with related data
uses and users
how the output was created
The changes signposted in this bulletin (see Background Notes – Sections 4 and 5) have not yet been reflected in either the Quality Survey of Capital Expenditure QMI or the Business Investment QMI, but changes will be incorporated into revised QMIs in the future.
Back to table of contents

