
Table of contents
- Main points
- What’s changed in this release?
- Things you need to know about this release
- How much is the public sector borrowing?
- How early estimates of net borrowing are improved over time
- How big is public sector debt?
- How much cash does the public sector need to raise?
- How was debt in the current financial year-to-date accumulated?
- How do these figures compare with official forecasts?
- Revisions since previous release
- International comparisons of borrowing and debt
- What will change in the next release?
- Quality and methodology
- Tell us what you think
1. Main points
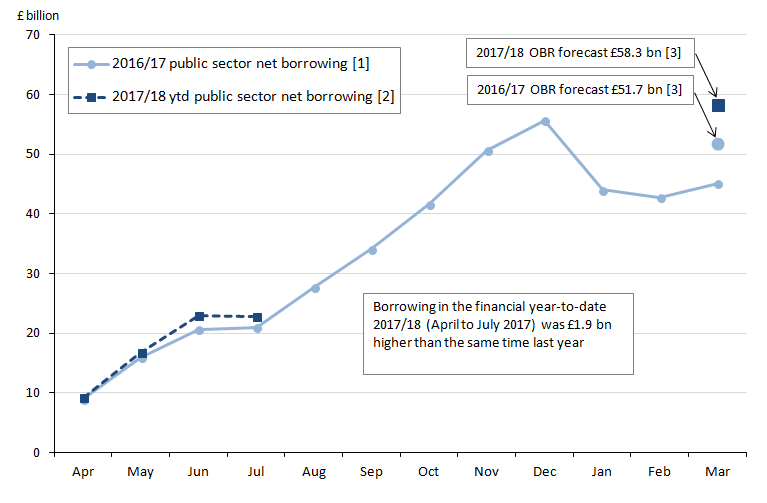
Public sector net borrowing (excluding public sector banks) increased by £1.9 billion to £22.8 billion in the current financial year-to-date (April 2017 to July 2017), compared with the same period in 2016.
The Office for Budget Responsibility (OBR) forecast that public sector net borrowing (excluding public sector banks) will be £58.3 billion during the financial year ending March 2018.
Public sector net borrowing (excluding public sector banks) was in surplus by £0.2 billion in July 2017, the first July surplus since 2002, while borrowing in July 2016 was £0.3 billion.
Public sector net borrowing (excluding public sector banks) decreased by £27.0 billion to £45.1 billion in the financial year ending March 2017 (April 2016 to March 2017) compared with the financial year ending March 2016; this is the lowest net borrowing since the financial year ending March 2008.
The Office for Budget Responsibility (OBR) forecast that public sector net borrowing (excluding public sector banks) would be £51.7 billion during the financial year ending March 2017.
Public sector net debt (excluding public sector banks) was £1,758.3 billion at the end of July 2017, equivalent to 87.5% of gross domestic product (GDP), an increase of £143.9 billion (or 4.5 percentage points as a ratio of GDP) on July 2016.
Public sector net debt (excluding both public sector banks and Bank of England) was £1,614.2 billion at the end of July 2017, equivalent to 80.3% of GDP; an increase of £43.9 billion (or a decrease of 0.4 percentage points as a ratio of GDP) on July 2016.
Central government net cash requirement decreased by £25.5 billion to £4.4 billion in the current financial year-to-date (April 2017 to July 2017), compared with the same period in 2016, largely as a result of two large cash transactions; this is the lowest year-to-date central government net cash requirement since 2002.
2. What’s changed in this release?
This section presents information on aspects of data or methodology that is important to understand when reading this bulletin. Where appropriate, further details of individual changes are discussed in the “Quality and methodology” section of this bulletin.
Self-assessed Income Tax
In both January and July (though to a lesser extent), accrued receipts are particularly high due to receipts from self-assessed Income Tax.
This month, receipts from self-assessed Income Tax increased by £0.8 billion to £8.0 billion, compared with July 2016. This is the highest level of July self-assessed Income Tax receipts on record (records began in 1999).
The revenue raised through self-assessed Income Tax, as well as primarily affecting January and July receipts, also tend to lead to higher receipts in the following month (February and August respectively), although to a lesser degree. It is advisable to look at the combined self-assessed Income Tax receipts for both July and August (or January and February) together when drawing conclusions from year-on-year comparisons.
Bank of England Asset Purchase Facility Fund (BEAPFF)
In July 2017, there was a £0.7 billion dividend transfer from the BEAPFF to HM Treasury. As with other such transfers, central government net borrowing will be reduced by an amount equivalent to the transfer, while the net borrowing of Bank of England will be increased by an equal and offsetting amount, with no effect at public sector borrowing level.
The Bank of England entrepreneurial income for the financial year ending March 2017 (April 2016 to March 2017) was calculated as £13.3 billion. This is the total amount of dividend transfers that can impact on central government net borrowing in the financial year ending March 2018 (April 2017 to March 2018). So far in the current financial year (April to July 2017), £5.1 billion in dividends have been transferred from the BEAPFF to HM Treasury.
Time series data
This month we have reviewed and improved the content of our downloadable time series data file consistent with the data underlying each public sector finance statistical bulletin and the accompanying public sector finances borrowing by sub-sector presentation.
Now, all data contained within these publications are available to download via the Public Sector Finances time series dataset. From April 1997 to date, where available, time series are presented as monthly data; with series extending further back in time, generally presented on a quarterly or financial year basis.
Time series exclusive to the public sector finances borrowing by sub-sector presentation are only available as quarterly time series, though these extend back to 1946.
Back to table of contents3. Things you need to know about this release
What are the most important terms I need to know?
Public sector net borrowing excluding public sector banks (PSNB ex) measures the gap between revenue raised (current receipts) and total spending (current expenditure plus net investment (capital spending less capital receipts)). Public sector net borrowing is often referred to as “the deficit”.
The public sector net cash requirement (PSNCR) represents the cash needed to be raised from the financial markets over a period of time to finance the government’s activities. This can be close to the deficit for the same period but there are some transactions, for example, loans to the private sector, which need to be financed but do not contribute to the deficit. It is also close but not identical to the changes in the level of net debt between two points in time.
Public sector net debt excluding public sector banks (PSND ex) represents the amount of money the public sector owes to private sector organisations including overseas institutions, largely as a result of issuing gilts and treasury bills, less the amount of cash and other short-term assets it holds.
While borrowing (or the deficit) represents the difference between total spending and receipts over a period of time, debt represents the total amount of money owed at a point in time.
The debt has been built up by successive government administrations over many years. When the government borrows (that is, runs a deficit), this normally adds to the debt total. So reducing the deficit is not the same as reducing the debt.
If you’d like to know more about the relationship between debt and deficit, please refer to our article The debt and deficit of the UK public sector explained.
What does the public sector include?
In the UK, the public sector consists of five sub-sectors: central government, local government, public non-financial corporations, Bank of England and public financial corporations (or public sector banks).
Unless otherwise stated, the figures quoted in this bulletin exclude public sector banks (that is currently only Royal Bank of Scotland (RBS)), as the reported position of debt (and to a lesser extent borrowing) would be distorted by the inclusion of RBS's balance sheet (and transactions). This is because government does not need to borrow to fund the debt of RBS, nor would surpluses achieved by RBS be passed on to government, other than through any dividends paid as a result of government equity holdings.
The sub-sector breakdown of public sector net borrowing is summarised in Table PSA2 in the Public sector finances Tables 1 to 10: Appendix A dataset.
Should I look at monthly or financial year-to-date data to understand public sector finances?
A financial year is an accounting period of 12 months running from 1 April one year to 31 March the following year. For example, the financial year ending March 2016 comprises the months from April 2015 to March 2016.
Due to the volatility of the monthly data, the cumulative financial year-to-date borrowing figures provide a better indication of the position of the public finances than the individual months.
Are our figures adjusted for inflation?
All monetary values in the public sector finances (PSF) bulletin are expressed in terms of “current prices‟, that is, they represent the price in the period to which the expenditure or revenue relates and are not adjusted for inflation.
In order to compare data over long time periods, to aid international comparisons and provide an indication of a country’s ability to service borrowing and debt, commentators often discuss changes over time to fiscal aggregates in terms of gross domestic product (GDP) ratios. GDP represents the value of all the goods and services currently produced by the UK economy in a period of time.
Are our figures adjusted for seasonal patterns?
All monetary values in the PSF bulletin are not seasonally adjusted. We recommend you use year-on-year comparisons (be it cumulative financial year-to-date or individual monthly borrowing figures) rather than making month-on-month comparisons.
Are our monthly figures likely to change over time?
Each PSF bulletin contains the first estimate of public sector borrowing for the most recent period and is likely to be revised in later months as more data become available.
In publishing monthly estimates, it is necessary to use a range of different types of data sources. Some of these are subject to revision as budget estimates (forecasts) are replaced by out-turn data and these then feed into the published aggregates. In addition to those that stem from updated data sources, revisions can also result from methodology changes. An example of the latter is the changes that were due to the introduction of improved methodology for the recording of Corporation Tax, Bank Corporation Tax Surcharge receipts and Bank Levy implemented in the PSF estimates released in February 2017.
How is the debt interest paid by the government affected by movements in the level of RPI?
Index-linked gilts, a form of government bond, are indexed to the Retail Prices Index (RPI). When the RPI rises, the inflation uplift that applies to index-linked cash flows (both regular coupon payments and final payment at gilt maturity) also rises. If the RPI should fall, the inflation uplift would also fall. In this way, the returns to the investor from holding index-linked gilts are maintained in real terms – as measured by the RPI.
Taking £100 as the unit price for a gilt, an index-linked gilt will pay more than £100 at redemption if the RPI increases over the life of the gilt. Similarly, if the RPI increases over the life of the gilt each coupon payment will be higher than the previous one; while if the RPI were to decrease, a coupon payment could be lower than the previous one.
Both the uplift on coupon payments and the uplift on the redemption value are recorded as debt interest paid by the government, so month-on-month there can be sizeable movements in payable government debt interest as a result of movements in the RPI.
Pre-release access to ONS statistics
On 15 June 2017, the National Statistician announced that from 1 July 2017 pre-release access to Office for National Statistics (ONS) statistics would cease. While there is no longer any pre-release access granted to the public sector finances bulletin, it should be noted that this bulletin remains jointly produced by members of the Government Statistical Service (GSS) working in both ONS and HM Treasury.
GSS staff will continue to work together to produce the bulletin but ministers and those officials not directly involved in the production and release of statistics will not have access to them in advance of publication.
Back to table of contents4. How much is the public sector borrowing?
In the current financial year-to date (April 2017 to July 2017), the public sector spent more money than it received in taxes and other income. This meant it had to borrow £22.8 billion; that is £1.9 billion more than in the same period in the previous financial year.
Of this £22.8 billion of public sector net borrowing excluding public sector banks (PSNB ex), £13.5 billion related to the cost of the “day-to-day” activities of the public sector (the current budget deficit), while £9.3 billion related to capital spending (or net investment) such as infrastructure.
Figure 1 presents both monthly and cumulative public sector net borrowing (excluding public sector banks) in the current financial year-to-date and compares these with the previous financial year.
Figure 1: Public sector net borrowing (excluding public sector banks)
UK, April 2016 to March 2017 and April 2017 to July 2017
Source: Office for National Statistics
Download this chart Figure 1: Public sector net borrowing (excluding public sector banks)
Image .csv .xlsThe difference between central government's income and spending makes the largest contribution to the amount borrowed by the public sector. In the current financial year-to-date, of the £22.8 billion borrowed by the public sector, £25.9 billion was borrowed by central government, while local government net borrowing was in surplus by £4.4 billion.
In the current financial year-to-date, central government received £226.6 billion in income; including £168.1 billion in taxes. This was around 4% more than in the same period in the previous financial year.
Over the same period, central government spent £245.9 billion; around 5% more than in the same period in the previous financial year. Of this amount, just below two-thirds was spent by central government departments (such as health, education and defence), around one-third on social benefits (such as pensions, unemployment payments, Child Benefit and Maternity Pay), with the remaining being spent on capital investment and interest on government’s outstanding debt.
Appendix D to this release contains a detailed breakdown of public sector current receipts.
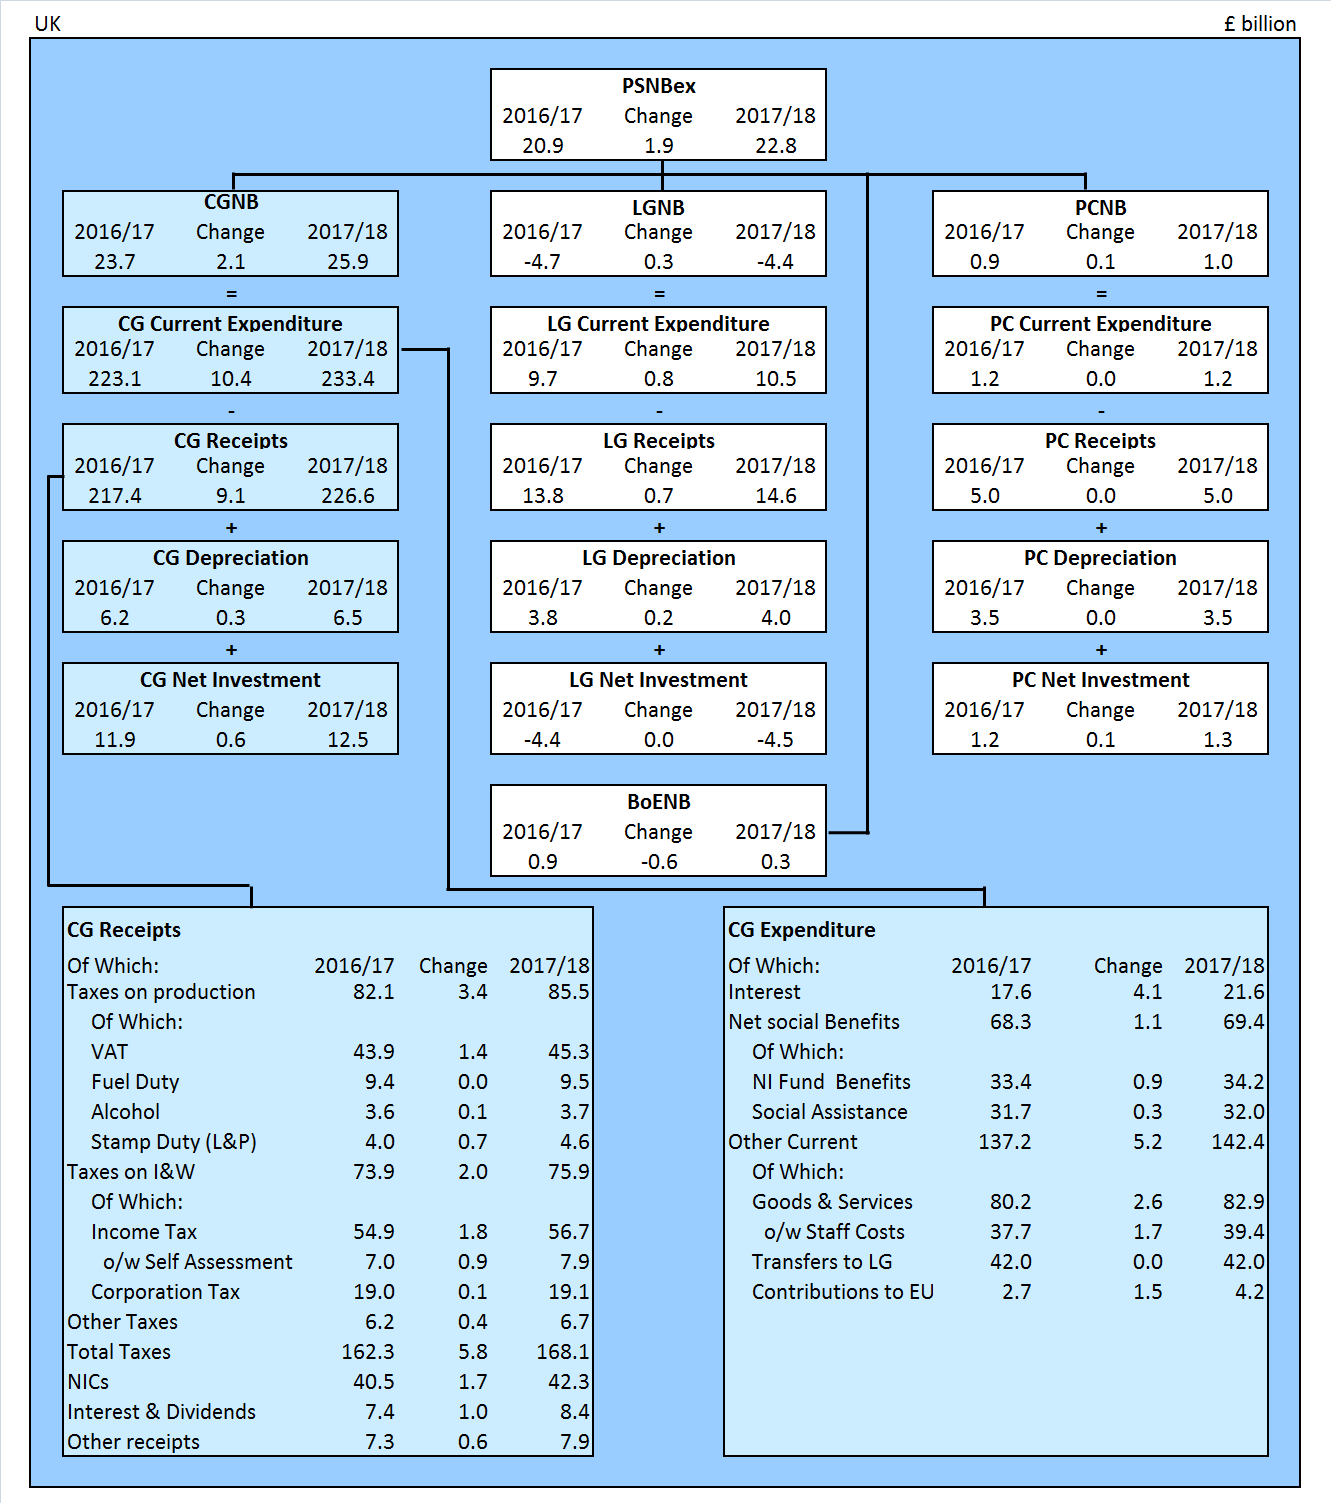
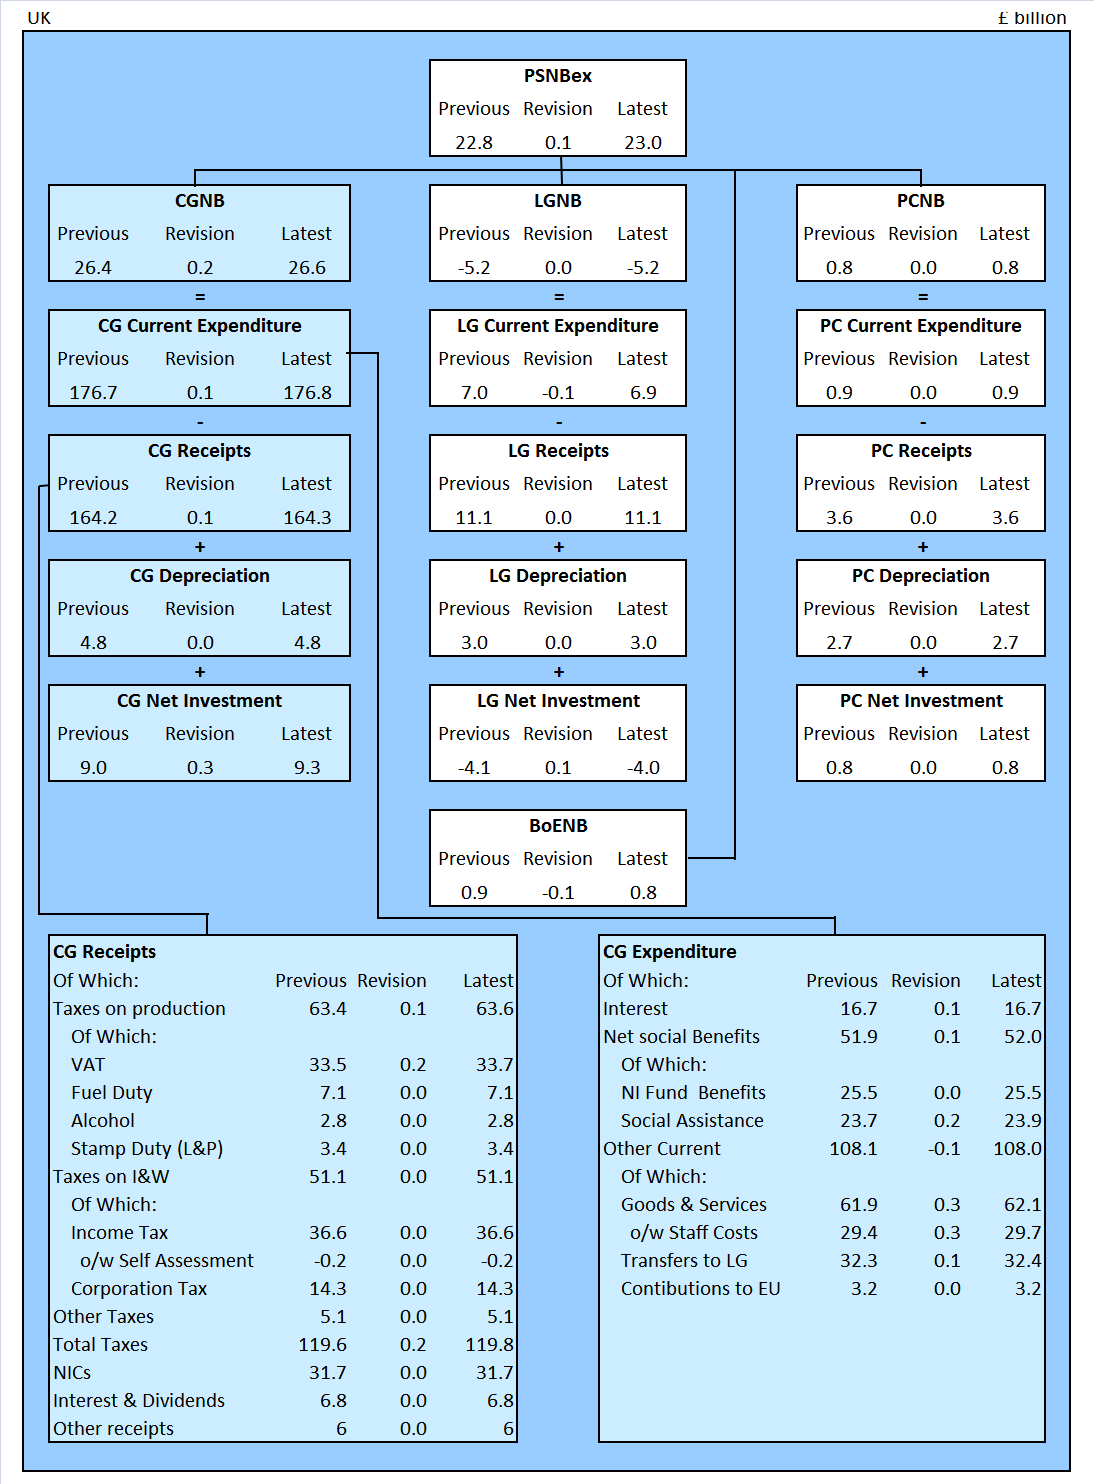
Figure 2 summarises public sector borrowing by sub-sector in the current financial year-to-date (April to July 2017) and compares these with the same period in the previous financial year.
This presentation splits PSNB ex into each of its four sub-sectors: central government, local government, public corporations and Bank of England.
A further breakdown (receipts, expenditure (both current and capital) and depreciation) is provided for central government, local government and public corporations; with central government current receipts and current expenditure being presented in further detail.
Figure 2: Contributions to public sector net borrowing (excluding public sector banks) by sub-sector in the current financial year-to-date (April to July 2017)
Source: Office for National Statistics
Notes:
- PSNBex - Public sector net borrowing excluding public sector banks.
- CGNB - Central government net borrowing.
- LGNB - Local government net borrowing.
- PCNB - Non-financial public corporations' net borrowing.
- BoENB - Bank of England net borrowing.
- L&P - Land and property.
- I&W - Income and wealth.
- NICs - National Insurance contributions.
- Contributions to EU - UK VAT, GNI and abatement contributions to the EU budget.
Download this image Figure 2: Contributions to public sector net borrowing (excluding public sector banks) by sub-sector in the current financial year-to-date (April to July 2017)
.png (121.6 kB) .xls (67.6 kB)
Figure 3 illustrates that annual borrowing has generally been falling since the peak in the financial year ending March 2010 (April 2009 to March 2010).
Current estimates indicate that in the full financial year ending March 2017 (April 2016 to March 2017), the public sector borrowed £45.1 billion, or 2.3% of gross domestic product (GDP). This was £27.0 billion lower than in the previous full financial year and around one-third of that in the financial year ending March 2010, when borrowing was £151.7 billion or 9.9% of GDP.
Figure 3: Public sector net borrowing (excluding public sector banks), April 1993 to July 2017
UK

Source: Office for National Statistics
Notes:
- Financial year 2017/18 represents the financial year ending 2018 (April 2017 to March 2018).
- Office for Budget Responsibility (OBR) full financial year forecast of £58.3 billion for public sector net borrowing excluding public sector banks (March 2017 Economic and Fiscal Outlook).
- Ytd equals year-to-date (April to July).
Download this image Figure 3: Public sector net borrowing (excluding public sector banks), April 1993 to July 2017
.png (36.4 kB) .xls (65.0 kB)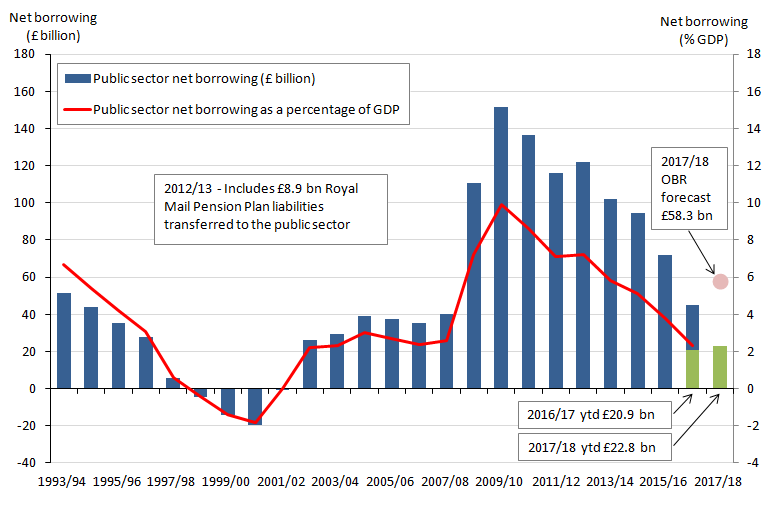
Focusing on the current month
In July 2017, the public sector spent less money than it received in taxes and other income. This meant it had a net borrowing surplus of £0.2 billion. Borrowing in July tends to be low compared with other months of the year due to the receipt of self-assessed Income Tax; however, this was the first July surplus since 2002.
Appendix D to this release contains a detailed breakdown of public sector current receipts.
Figure 4 summarises public sector borrowing by sub-sector in July 2017 and compares this with the equivalent measures in the same month a year earlier (July 2016).
This presentation splits public sector net borrowing excluding public sector banks (PSNB ex) into each of its four sub-sectors: central government, local government, public corporations and Bank of England.
A further breakdown (receipts, current expenditure, capital expenditure and depreciation) is provided for central government, local government and public corporations; with central government current receipts and current expenditure being presented in further detail.
Both local government and public corporations data for July 2017 are initial estimates. Most of these components are calculated by Office for National Statistics (ONS) based on Office for Budget Responsibility (OBR) forecasts. Administrative source data are used for transfers to each of these sectors from central government.
Figure 4: Contributions to public sector net borrowing (excluding public sector banks) by sub-sector in July 2017, compared with July 2016

Source: Office for National Statistics
Notes:
- PSNBex - Public sector net borrowing excluding public sector banks.
- CGNB - Central government net borrowing.
- LGNB - Local government net borrowing.
- PCNB - Non-financial public corporations' net borrowing.
- BoENB - Bank of England net borrowing.
- L&P - Land and property.
- I&W - Income and wealth.
- NICs - National Insurance contributions.
- Contributions to EU - UK VAT, GNI and abatement contributions to the EU budget.
Download this image Figure 4: Contributions to public sector net borrowing (excluding public sector banks) by sub-sector in July 2017, compared with July 2016
.png (114.1 kB) .xls (67.6 kB)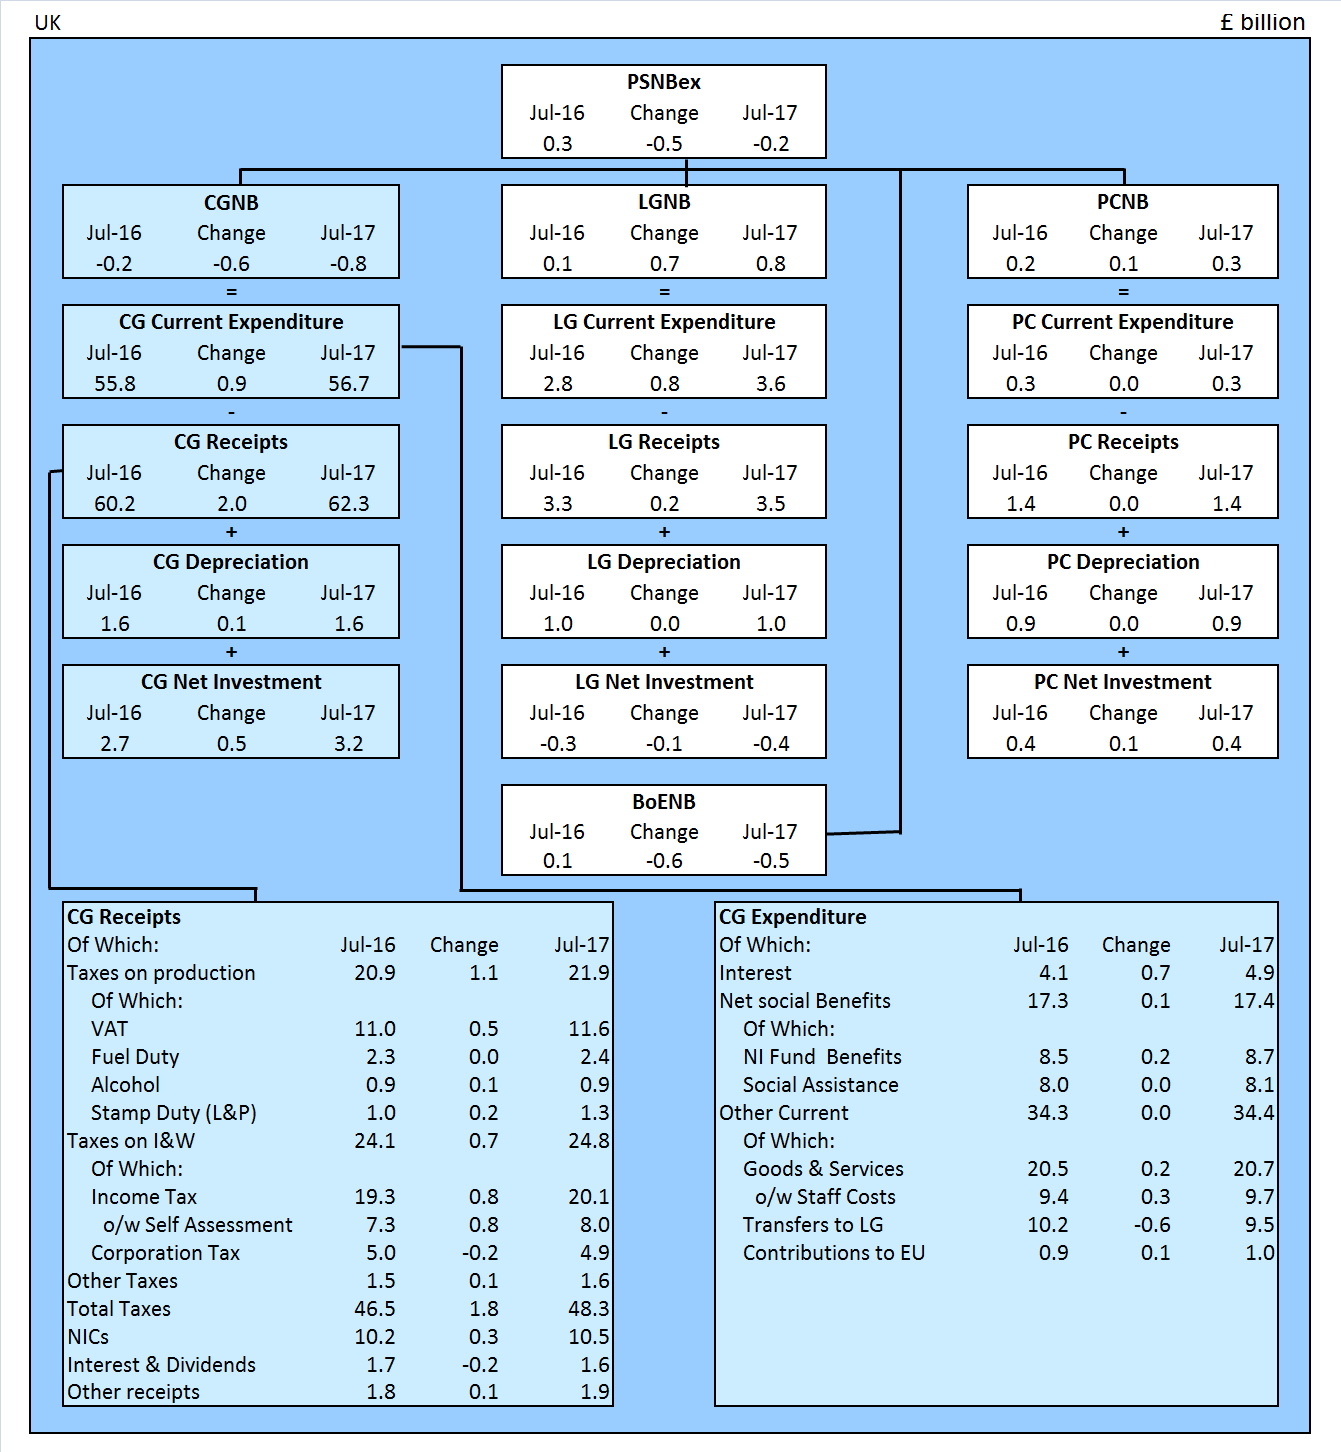
5. How early estimates of net borrowing are improved over time
Since the first estimate of public sector net borrowing (excluding public sector banks) for the financial year ending March 2017 (April 2016 to March 2017), was published on 25 April 2017, the estimate has been revised downwards by £6.9 billion, from £52.0 billion to £45.1 billion; these are still not final figures and will be revised over the coming months as we replace our initial estimates with provisional and then final out-turn data.
The data for the latest month of every release contains some forecast data. The initial out-turn estimates for the early months of the financial year, particularly April, contain more forecast data than other months, as profiles of tax receipts, along with departmental and local government spending are still provisional. This means that the data for these months are typically more prone to revision than other months and can be subject to sizeable revisions in later months.
Appendix G: Revisions to the first reported estimate of financial-year-end public sector net borrowing (excluding public sector banks) by sub-sector; summarises revisions to the first estimate of public sector net borrowing (excluding public sector banks) by sub-sector for the last 6 financial years. Revisions are shown at 6 and 12 months after year end.
We have published an article, Public Sector Finances – Sources summary and their timing, which provides a brief summary of the different sources used and the implications of using those data in the monthly public sector finances (PSF) statistical bulletin.
Back to table of contents6. How big is public sector debt?
The amount of money owed by the public sector to the private sector stood at nearly £1.8 trillion at the end of July 2017, which equates to 87.5% of the value of all the goods and services currently produced by the UK economy in a year (or gross domestic product (GDP)).
This £1.8 trillion (or £1,758.3 billion) debt at the end of July 2017 represents an increase of £143.9 billion since the end of July 2016. Of this £143.9 billion, £100.0 billion is attributable to debt accumulated within the Bank of England, nearly all of it in the Asset Purchase Facility. Of this £100.0 billion, £78.3 billion relates to the Term Funding Scheme (TFS).
Figure 5 breaks down outstanding public sector net debt at the end of July 2017 into the sub-sectors of the public sector. In addition to public sector net debt excluding public sector banks (PSND ex), this presentation includes the effect of public sector banks on debt.
Figure 5: Contributions to public sector net debt by sub-sector at the end of July 2017
UK
Source: Office for National Statistics
Notes:
- PSND - Public sector net debt.
- PSBsND - Public sector Banks net debt.
- PSNDex - Public sector net debt excluding public sector banks.
- BoEND - Bank of England's contribution to net debt.
- PSND ex Boe - Public sector net debt excluding both public sector banks and Bank of England.
- NFPCND - Non-financial public corporations' net debt.
- GGND - General government net debt.
Download this chart Figure 5: Contributions to public sector net debt by sub-sector at the end of July 2017
Image .csv .xlsNet debt is defined as total gross financial liabilities less liquid financial assets, where liquid assets are cash and short-term assets, which can be released for cash at short notice without significant loss. These liquid assets mainly comprise foreign exchange reserves and bank deposits.
Figure 6 presents public sector net debt excluding public sector banks (PSND ex) at the end of July 2017 by sub-sector. Time series for each of these component series are presented in Tables PSA8A to D in the Public sector finances Tables 1 to 10: Appendix A dataset.
Figure 6: Contributions to public sector net debt (excluding public sector banks) by sub-sector at the end of July 2017 (£ billion)
UK

Source: Office for National Statistics
Notes:
- Cross-holdings between sub-sectors are removed in calculating public sector net debt, gross debt and liquid assets.
- APF - Bank of England Asset Purchase Facility.
Download this image Figure 6: Contributions to public sector net debt (excluding public sector banks) by sub-sector at the end of July 2017 (£ billion)
.png (73.4 kB) .xls (166.4 kB)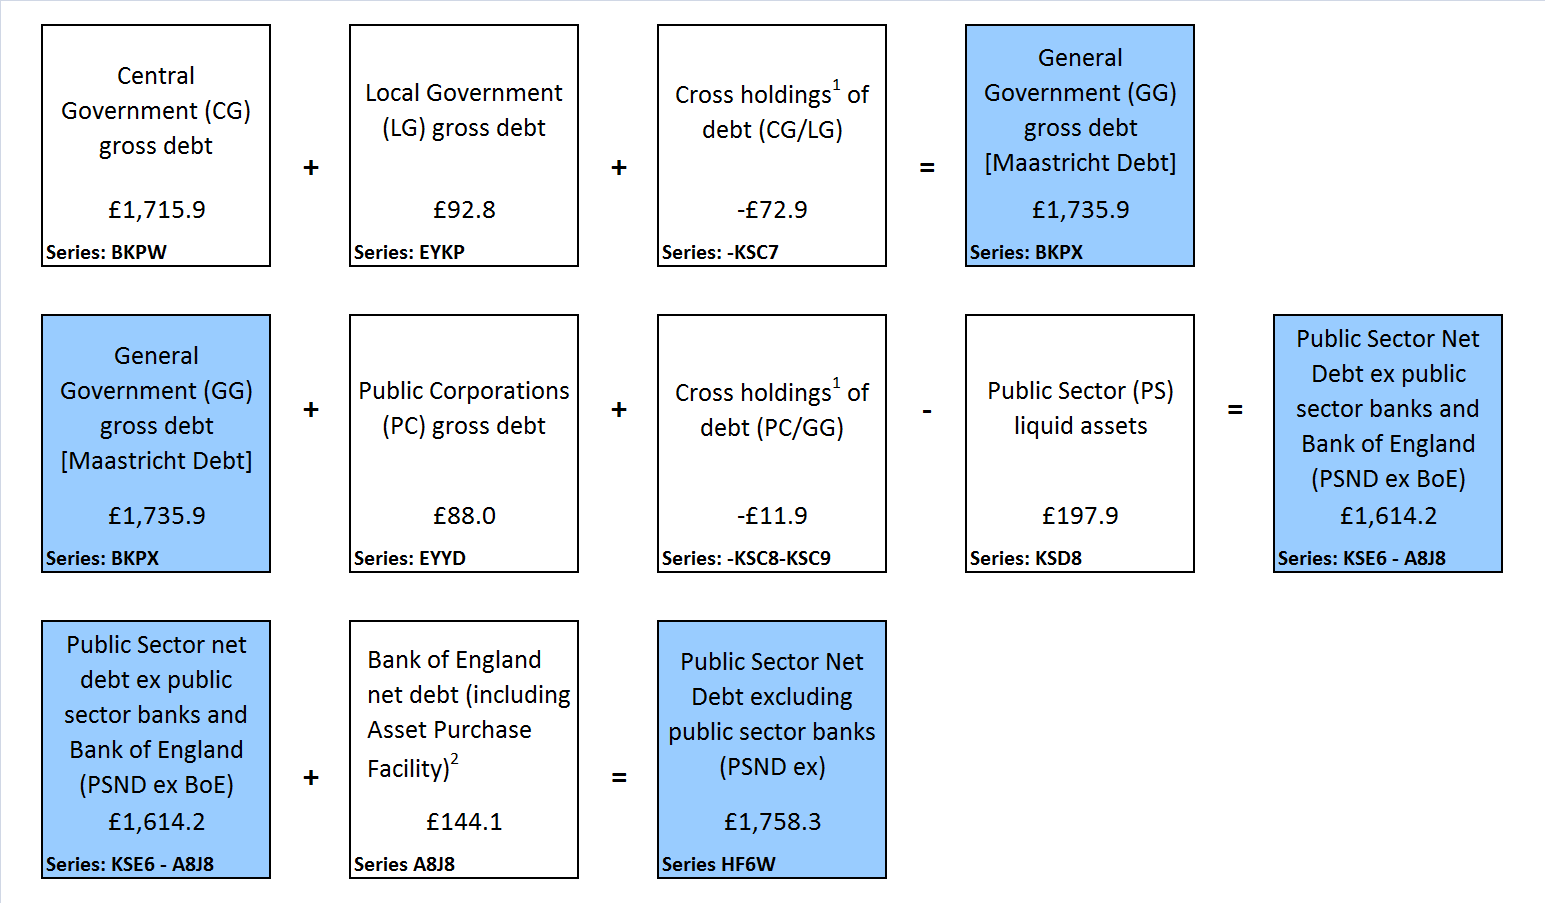
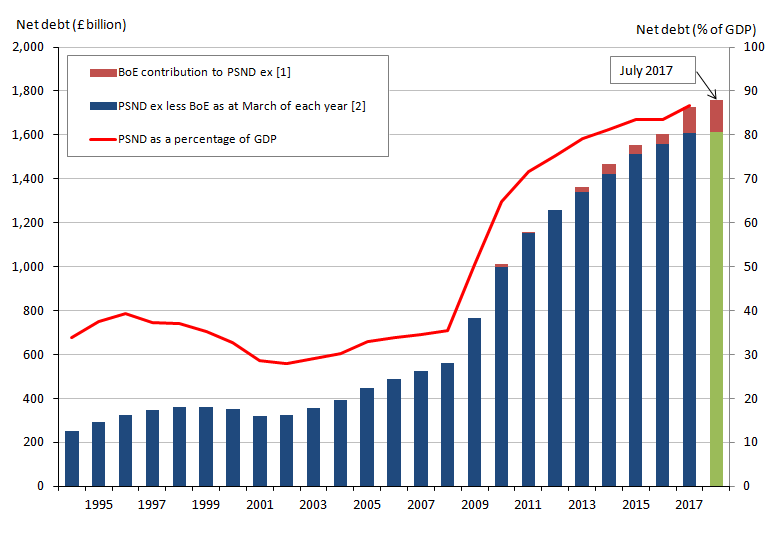
Figure 7 illustrates PSND ex from the financial year ending March 1994 to the end of July 2017.
Figure 7: Public sector net debt (excluding public sector banks), March 1994 to the end of July 2017
UK
Source: Office for National Statistics
Notes:
- Includes Asset Purchase Facility (APF), which includes the Term Funding Scheme (TFS).
- Public sector net debt excluding public sector banks (PSND ex) is the combination of PSND ex less Bank of England (BoE) plus BoE contribution to PSND ex.
Download this image Figure 7: Public sector net debt (excluding public sector banks), March 1994 to the end of July 2017
.png (36.6 kB) .xls (47.1 kB)
PSND ex increased at the time of the economic downturn. Since then, it has continued to increase but at a slower rate. The introduction of the Term Funding Scheme in late 2016 has led to a rise in net debt, as the loans provided under the scheme are not liquid assets and therefore do not net off in public sector net debt (against the liabilities incurred in providing the loans).
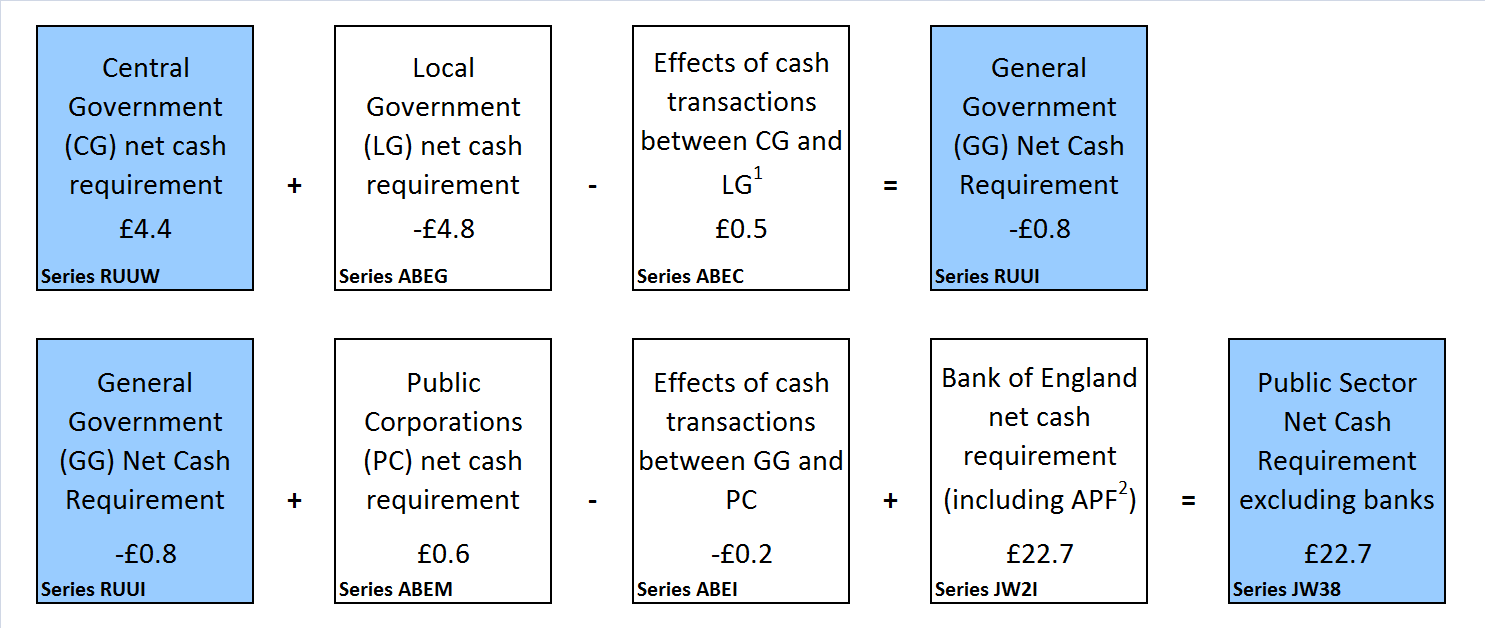
Back to table of contents7. How much cash does the public sector need to raise?
The net cash requirement is a measure of how much cash the public sector needs to raise from the financial markets (or pay out from its cash reserves) to finance its activities. This amount can be close to the deficit for the same period but there are some transactions, for example, lending to the private sector or the purchase of shares, that need to be financed but do not contribute to the deficit. Similarly, repayments of principal on loans extended by government or sales of shares will reduce the level of financing necessary but not reduce the deficit.
Figure 8 presents public sector cash requirement by sub-sector in the current financial year-to-date (April 2017 to July 2017). Time series for each of these component series are presented in Table PSA7A in the Public sector finances Tables 1 to 10: Appendix A dataset.
Figure 8: Contributions to public sector net cash requirement (excluding public sector banks) by sub-sector in the current financial year-to-date (April to July 2017) (£ billion)
UK
Source: Office for National Statistics
Notes:
- Effects of cash transactions between sub-sectors are removed in calculating public sector total net cash requirement (and consolidated expenditure and income totals).
- APF - Bank of England Asset Purchase Facility.
Download this image Figure 8: Contributions to public sector net cash requirement (excluding public sector banks) by sub-sector in the current financial year-to-date (April to July 2017) (£ billion)
.png (53.1 kB) .xls (152.1 kB)
Central government net cash requirement (CGNCR) is a focus for some users, as it provides an indication of the volume of gilts (government bonds) the Debt Management Office may issue to meet the government’s borrowing requirements.
In the current financial year-to-date (April to July 2017), central government net cash requirement (CGNCR) was £4.4 billion, that is, £25.5 billion less than in the same period in the previous year. A number of one-off factors have led to this decrease, notably:
- the sale of £11.8 billion of Bradford and Bingley loans to Prudential plc in April 2017, reducing CGNCR by a corresponding amount in the current financial year-to-date
- the redemption of a 2.5% index linked gilt in July 2016 required £9.4 billion to repay investors, increasing CGNCR by a corresponding amount in the previous financial year-to-date
CGNCR is quoted both including and excluding the net cash requirement of Network Rail (NR) and UK Asset Resolution LTD (UKAR) (which manages the closed mortgage books of both Bradford and Bingley, and Northern Rock Asset Management). It is the CGNCR excluding NR and UKAR that is the particular focus of users with an interest in the gilt market.
CGNCR excluding NR and UKAR decreased by £27.1 billion to £5.5 billion in the current financial year-to-date (April 2017 to July 2017), compared with the same period in 2016.
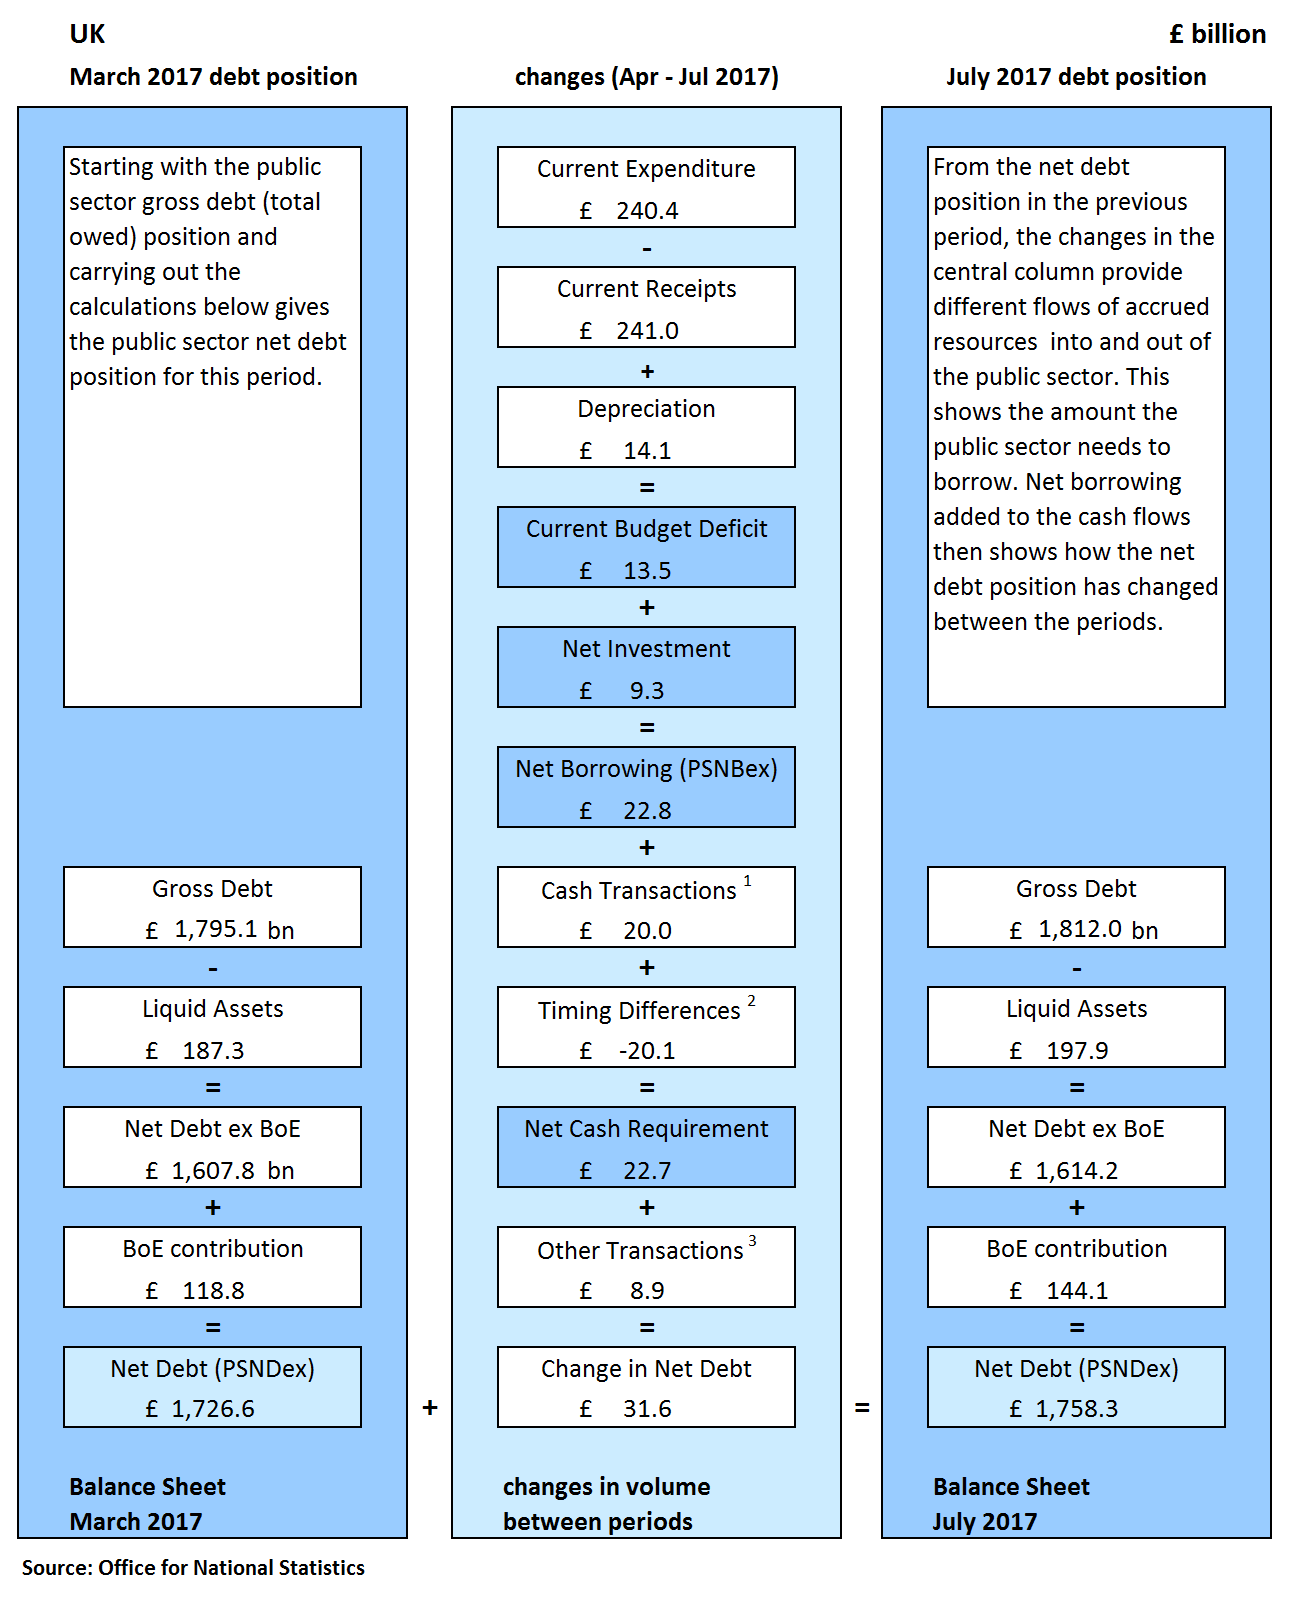
Back to table of contents8. How was debt in the current financial year-to-date accumulated?
Figure 9 brings together the borrowing components detailed in Figure 2 to illustrate how the differences between income and spending (both current and capital) have led to the accumulation of debt in the current financial year-to-date (April to July 2017).
This presentation excludes public sector banks, focusing instead on the public sector net borrowing excluding public sector banks (PSNB ex) measure.
Figure 9: How the difference in expenditure and receipts impact on public sector net debt (excluding public sector banks)
Source: Office for National Statistics
Notes:
- Cash transactions in (non-financing) financial assets, which do not impact on net borrowing.
- Timing differences between cash and accrued data.
- Revaluation of foreign currency debt (for example, foreign currency). Debt issuances or redemptions above or below debt valuation (for example, bond premia and discounts and capital uplifts). Changes in volume of debt not due to transactions (for example, sector reclassification).
Download this image Figure 9: How the difference in expenditure and receipts impact on public sector net debt (excluding public sector banks)
.png (135.0 kB) .xls (42.5 kB)
The reconciliation between public sector net borrowing and net cash requirement is presented in more detail in Table REC1 in the Public sector finances Tables 1 to 10: Appendix A dataset.
Back to table of contents9. How do these figures compare with official forecasts?
The Office for Budget Responsibility (OBR) normally produces forecasts of the public finances twice a year (currently in March and November). The latest OBR forecast was published on 8 March 2017.
The government has adopted OBR forecasts as its official forecast.
OBR forecast that the public sector would borrow £51.7 billion during the financial year ending March 2017, a reduction of £20.5 billion on out-turn for the financial year ending March 2016. The provisional out-turn estimate for the financial year ending March 2017 was £45.1 billion; that is £6.6 billion less than the OBR forecast.
OBR forecast that the public sector will borrow £58.3 billion during the current financial year (April 2017 to March 2018); an increase of £13.2 billion on the current out-turn estimate for the financial year ending March 2017. In the current financial year-to-date (April to July 2017), the public sector has borrowed £22.8 billion; an increase of £1.9 billion on the same period in the last financial year.
Figure 10 presents the cumulative public sector net borrowing for the latest and previous full financial years. The figure also presents the OBR forecasts for the corresponding financial years.
Figure 10: Cumulative public sector net borrowing (excluding public sector banks)
UK, April 2016 to March 2017 and April 2017 to July 2017
Source: Office for National Statistics
Notes:
- For the financial year ending 2017 (April 2016 to March 2017).
- For the financial year-to-date ending 2018 (April to July 2017).
- OBR forecast for public sector net borrowing excluding public sector banks from March 2017 Economic and Fiscal Outlook (EFO).
Download this image Figure 10: Cumulative public sector net borrowing (excluding public sector banks)
.png (21.8 kB) .xls (171.5 kB)
Table 1 compares the first estimates of full financial year data against the OBR forecasts. Caution should be taken when comparing public sector finances data with OBR figures for the full financial year, as data are not finalised until after the financial year ends.
Initial estimates soon after the end of the financial year can be subject to sizeable revisions in later months.
In addition, the monthly path of spending and receipts is not smooth within the year and also can vary compared with previous years, both of which can affect year-on-year comparisons.
There can also be methodological differences between OBR forecasts and out-turn data. In its latest publication, OBR published a table within its Economic and fiscal outlook supplementary fiscal tables: receipts and other – March 2017 titled “Table 2.46: Items included in OBR forecasts that ONS have not yet included in out-turn”.
Table 1: Latest outturn estimates compared with Office for Budget Responsibility (OBR) forecasts
| UK, April 2016 to March 2017 and April 2017 to July 2017, excluding public sector banks | £ billion1 (not seasonally adjusted) | ||||||
| Financial year-to-date7 | Full financial year8 | ||||||
| 2016/17 | 2017/188 | % change | 2016/17 Outturn | 2017/18 OBR Forecast9 | % change | ||
| Current budget deficit2 | 12.3 | 13.5 | 9.7 | 7.0 | 18.2 | 159.6 | |
| Net investment3 | 8.6 | 9.3 | 8.0 | 38.2 | 40.1 | 4.9 | |
| Net borrowing 4 | 20.9 | 22.8 | 9.0 | 45.1 | 58.3 | 29.2 | |
| Net debt 5 | 1,614.4 | 1,758.3 | 8.9 | 1,726.6 | 1,829.7 | 6.0 | |
| Net debt as a percentage of GDP6 | 83.0 | 87.5 | NA | 86.8 | 88.8 | NA | |
| Source: Office for National Statistics | |||||||
| Notes: | |||||||
| 1. Unless otherwise stated. | |||||||
| 2. Current budget deficit is the difference between current expenditure (including depreciation) and current receipts. | |||||||
| 3. Net investment is gross investment (net capital formation plus net capital transfers) less depreciation. | |||||||
| 4. Net borrowing is current budget deficit plus net investment. | |||||||
| 5. Net debt is financial liabilities (for loans, deposits, currency and debt securities) less liquid assets. | |||||||
| 6. GDP at current market price. | |||||||
| 7. Financial year-to-date refers to the period from April to July. | |||||||
| 8. 2017/18 refers to financial year ending in March 2018 and 2016/17 refers to financial year ending in March 2017. | |||||||
| 9. All OBR figures are from the OBR Economic and Fiscal Outlook published in March 2017. | |||||||
| 10. NA denotes "not applicable". | |||||||
Download this table Table 1: Latest outturn estimates compared with Office for Budget Responsibility (OBR) forecasts
.xls (35.3 kB)10. Revisions since previous release
Revisions can be the result of both updated data sources and methodology changes. This month the reported revisions are solely the result of data changes.
Table 2 summarises revisions to the headline statistics presented in this bulletin compared with those presented in the previous publication (published on 21 July 2017).
Table 2: Revisions to key aggregates since the previous bulletin
| UK, previous bulletin refers to the PSF bulletin published on 21 July 2017 | ||||||||
| £ billion1 (not seasonally adjusted) | ||||||||
| Net borrowing | ||||||||
| Period | CG2 | LG3 | NFPCs4 | BoE5 | PSNB ex6 | PSND ex7 | PSND % of GDP | PSNCR ex8 |
| 2013/14 | 0.0 | 0.0 | 0.0 | 0.0 | 0.0 | 0.0 | 0.0 | 0.0 |
| 2014/15 | 0.0 | 0.0 | 0.0 | 0.0 | 0.0 | 0.0 | 0.0 | 0.0 |
| 2015/16 | 0.0 | 0.0 | 0.0 | 0.0 | 0.0 | 0.0 | 0.0 | 0.0 |
| 2016/17 | -1.1 | 0.0 | 0.0 | 0.0 | -1.1 | -0.1 | 0.0 | 0.0 |
| 2017/18 ytd10 | 0.2 | 0.0 | 0.0 | -0.1 | 0.1 | 5.1 | 0.3 | 0.1 |
| 2017 April | 0.3 | -0.1 | 0.0 | 0.0 | 0.3 | 0.0 | 0.0 | 0.0 |
| 2017 May | 0.5 | 0.0 | 0.0 | 0.0 | 0.5 | 5.5 | 0.3 | 0.0 |
| 2017 Jun | -0.6 | 0.1 | 0.0 | -0.1 | -0.6 | 5.1 | 0.3 | 0.1 |
| Source: Office for National Statistics | ||||||||
| Notes: | ||||||||
| 1. Unless otherwise stated. | ||||||||
| 2. Central government. | ||||||||
| 3. Local government. | ||||||||
| 4. Non-financial public corporations. | ||||||||
| 5. Bank of England. | ||||||||
| 6. Public sector net borrowing excluding public sector banks. | ||||||||
| 7. Public sector net debt excluding public sector banks. | ||||||||
| 8. Public sector net cash requirement excluding public sector banks. | ||||||||
| 9. 2016/17 represents financial year ending 2017 (April 2016 to March 2017). | ||||||||
| 10. Ytd equals year-to-date, April to June 2017. | ||||||||
Download this table Table 2: Revisions to key aggregates since the previous bulletin
.xls (36.4 kB)Revisions to net borrowing in the current financial year
Figure 11 compares the latest estimate of public sector net borrowing excluding public sector banks (PSNB ex) for the period April to June 2017, with that presented in the previous bulletin (21 July 2017).
This presentation splits PSNB ex into each of its four sub-sectors: central government, local government, public corporations and Bank of England (BoE).
Given that, in the latest full financial year, £36.9 billion of the £45.1 billion borrowed by the public sector was borrowed by central government, a further breakdown of central government current receipts and current expenditure is presented to reflect the significance of these components.
Revisions to net borrowing in previous financial years
In the financial year ending March 2017 (April 2016 to March 2017), the estimate of central government net borrowing has been reduced by £1.1 billion since that presented in the previous bulletin (publish on 21 July 2017). This change is largely due to revisions to tax data supplied by HM Revenues and Customs (HMRC), leading to an increase in the estimate of government receipts. Estimates of Income Tax and Value Added Tax (VAT) have been revised upwards by £1.0 billion and £0.3 billion respectively.
Revisions to net debt at the end of June 2017
Since our previous publication, the estimate of public sector net debt excluding public sector banks (PSND ex) recorded at the end of June 2017 has increased by £5.1 billion. Of this £5.1 billion revision, £5.0 billion is a result of new cash data received from the Bank of England covering the Term Funding Scheme, impacting on the Bank of England’s contribution to net debt in both May and June 2017.
The reporting of errors in the public sector finance dataset
It is important to note that revisions do not occur as a result of errors; errors lead to corrections and are identified as such when they occur. There are no errors reported in this publication.
Figure 11: Latest estimate of public sector net borrowing (excluding public sector banks) over the period April to June 2017, compared with that presented in the previous bulletin (21 July 2017)
Source: Office for National Statistics
Notes:
- PSNBex - Public sector net borrowing excluding public sector banks.
- CGNB - Central government net borrowing.
- LGNB - Local government net borrowing.
- PCNB - Non-financial public corporations' net borrowing.
- BoENB - Bank of England net borrowing.
- L&P - Land and property.
- I&W - Income and wealth.
- NICs - National insurance contributions.
- Contributions to EU - UK VAT, GNI and abatement contributions to the EU budget.
Download this image Figure 11: Latest estimate of public sector net borrowing (excluding public sector banks) over the period April to June 2017, compared with that presented in the previous bulletin (21 July 2017)
.png (102.3 kB) .xls (68.1 kB)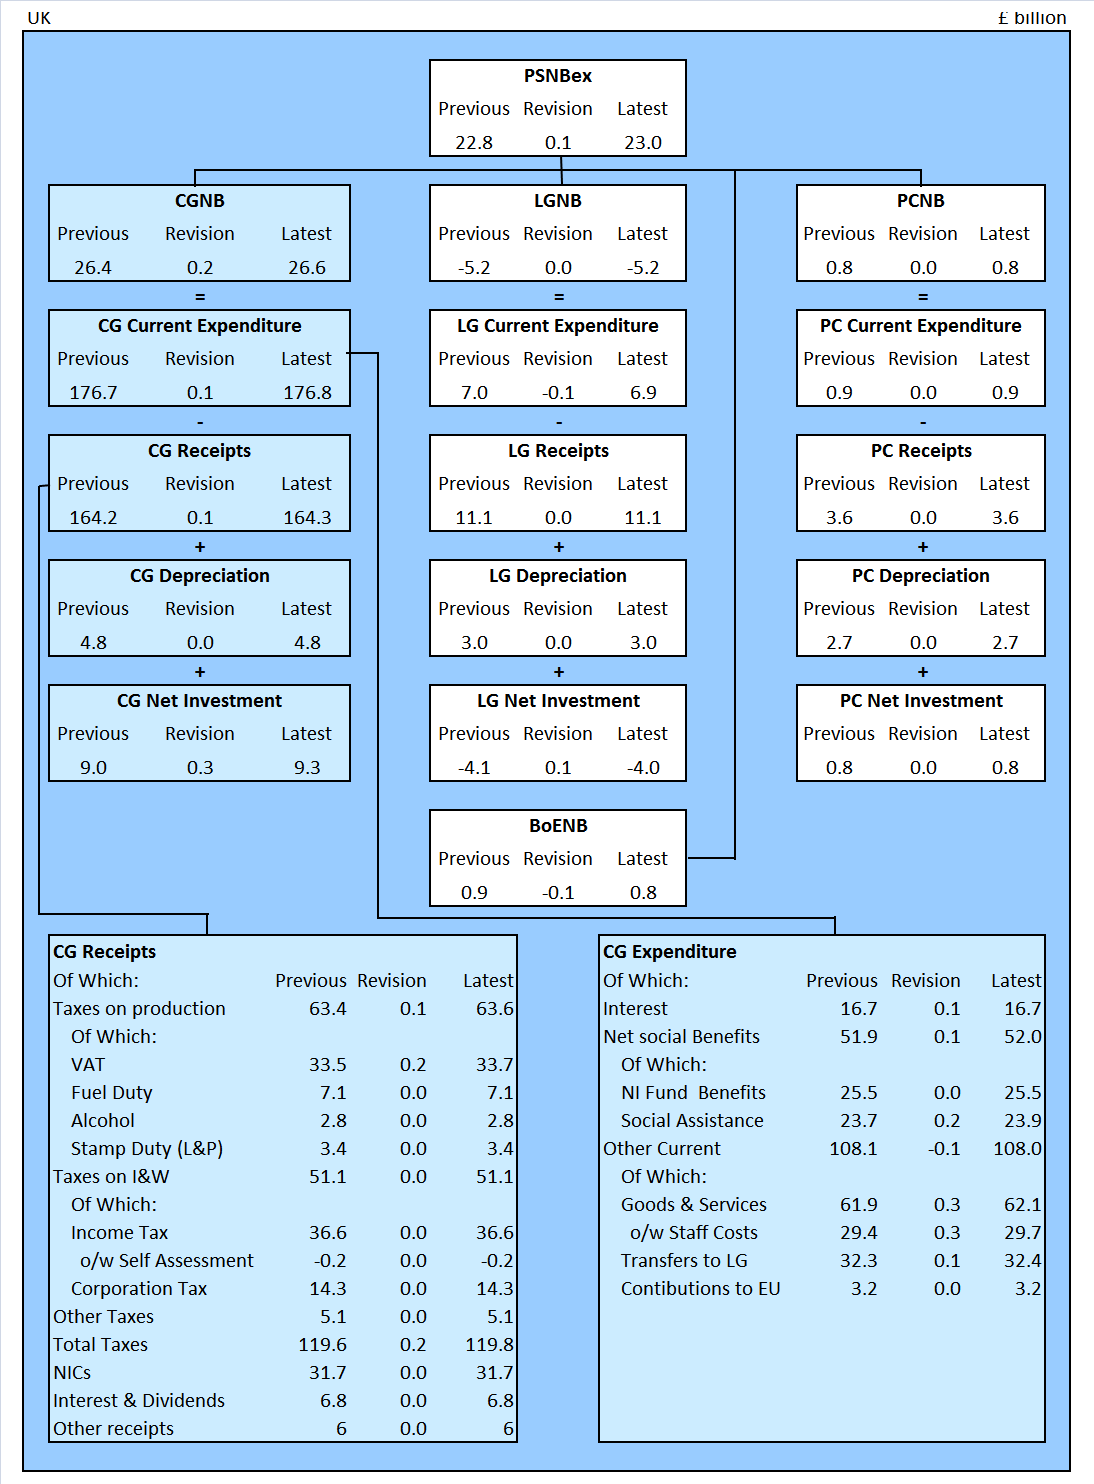
11. International comparisons of borrowing and debt
The UK government debt and deficit for Eurostat statistical bulletin is published quarterly (in January, April, July and December each year), to coincide with when the UK and other EU member states are required to report on their deficit (or net borrowing) and debt to the European Commission.
On 17 July 2017, we published the latest UK government debt and deficit for Eurostat statistical bulletin, consistent with the May 2017 public sector finances bulletin (published on 21 June 2017). In this publication we stated that:
general government gross debt was £1,720.1 billion at the end of March 2017, equivalent to 88.0% of gross domestic product (GDP); an increase of £68.1 billion on March 2016
general government deficit (or net borrowing) decreased by £28.2 billion to £47.0 billion (equivalent to 2.4% of GDP) in the financial year ending March 2017 (April 2016 to March 2017), compared with the previous financial year
This bulletin reports an unchanged estimate of general government gross debt and a £1.5 billion reduction to the estimate of deficit in the financial year ending March 2017, compared with those published on 17 July 2017.
It is important to note that the GDP measure, used as the denominator in the calculation of the debt ratios in the UK government debt and deficit for the Eurostat statistical bulletin, differs from that used within the public sector finances statistical bulletin.
An article, The use of GDP in public sector fiscal ratio statistics explains that for debt figures reported in the monthly public sector finances, a 12-month GDP total centred on the month is employed, while in the UK government debt and deficit for Eurostat statistical bulletin, the total GDP for the preceding 12 months is used.
Back to table of contents12. What will change in the next release?
Blue Book 2017
In September 2017, the public sector finances will incorporate both new data and methodological improvements in line with the annual UK National Accounts publication, the Blue Book 2017. This section outlines the main methodology changes we plan to introduce next month and where available, provides estimates of the effect on our main fiscal aggregates.
On 21 August 2017, National Accounts published an article providing a Detailed assessment of changes to sector and financial accounts, 1997 to 2015. This article provides indicative estimates of the revisions to the non-financial and financial accounts that will be published on 29 September 2017, compared to those previously published in the Blue Book 2016. Some of the methodological changes discussed in the paper, such as the reclassification of English private registered providers of social housing (referred to here as housing associations) from private to public sector have already been implemented in public sector finance and so the impact suggested in the article will be observed to a lesser extent in this publication.
The impact of the various planned revisions in the September 2017 public sector finances release are estimated to decrease public sector net borrowing in the financial year ending March 2017 by approximately £2.1 billion. This figure is indicative only and is based on net borrowing being revised by -£1.0 billion from changes to pension schemes, -£0.5 billion through the inclusion of the Victim Surcharge and other departmental income (including fines), -£0.6 billion through changes to public corporation and local government data relating to Rail for London and Tube Lines Ltd.
Other changes such as those to Vehicle Excise Duty and parking fines are neutral in terms of public sector net borrowing whereas some improvements, such as those to the recording of English housing associations and public corporations' gross fixed capital formation, have no impact on figures for the financial year ending March 2017.
Vehicle Excise Duty
Historically, Vehicle Excise Duty (VED) was split by fixed proportions between a tax on production for private producers and a tax on income from household consumers. This method has been improved, with estimates from the Annual Business Survey for all producing sectors being used to more accurately estimate these proportions.
This improvement is neutral for central government net borrowing, but will result in changes to the proportion of VED attributable to taxes on production and taxes on income. Taxes on production from private producers will increase from April 1997 onwards, with those recorded as taxes on income from household consumers decreasing by an equal and opposite offsetting amount over the same period.
In the financial year ending March 2017, the VED recorded as paid by businesses will increase by £1.0 billion, whereas the VED recorded as paid by households will decrease by £1.0 billion, with no net impact on central government receipts.
Current transfers to government
Previously we announced a programme of quality assurance work undertaken by ONS and HM Treasury that had identified some additional departmental income that was not incorporated in the public sector finances. As a result of this work, in September 2017, we plan to improve the data sources used to measure a small number of fees and fines and introduce, for the first time, the proceeds of the Victims Surcharge and a few other miscellaneous fines not previously recorded.
Any additional departmental income has the effect of reducing central government net borrowing (CGNB) and subsequently public sector net borrowing (PSNB). The government raised £44 million from Victims Surcharge receipts and £222 million in other miscellaneous fines not previously recorded in the financial year ending March 2016; subsequently reducing PSNB by £0.3 billion over the same period.
Parking fines
Income from parking fines received by local authorities will no longer be recorded in the category payments for non-market output – a negative component of current expenditure – and will instead be recorded in the category other current transfers, a component of current receipts.
This change will be introduced with effect from the financial year ending March 1998 and we estimate that the effect will be between £0.1 billion and £0.4 billion per financial year. The change is neutral for local government net borrowing and public sector net borrowing, because both local government current expenditure and local government current receipts will increase by equal amounts.
British Broadcasting Corporation subsidiaries
We intend to improve our data covering the British Broadcasting Corporation’s (BBC) commercial subsidiaries. These subsidiaries are considered to be market bodies and have therefore been classified to the public corporation sector, whereas the remainder of the BBC is classified to central government.
New data will come from audited and published financial statements of the BBC's commercial subsidiaries, replacing the in-year (unaudited) survey information. These changes will take effect from the financial year ending March 2009, where the effect on public sector net borrowing will be a downward revision of £0.1 billion to £0.2 billion with no effect on public sector net debt.
Pensions
Work to improve pension estimates in the National Accounts has resulted in improved data for funded and unfunded public sector pension schemes being used in the public sector finances. Data improvements related to unfunded pension schemes will also be implemented in Blue Book 2017; however, improvements in data of funded pension schemes will not be included in Blue Book 2017, but a future Blue Book.
Flows associated with unfunded pension schemes
Data sources and methods for compiling the unfunded public sector pension scheme statistics have been reviewed. This will result in changes to the way imputed contributions are modelled, where we have judged that zero is a reasonable approximation to the true value of imputed contributions, into schemes which regularly adjust the contribution rates.
We have also concluded that pension transfers in and out of unfunded schemes should be separated from social contributions (D.61) and social benefits (D.62), and instead recorded as other capital transfers (D.99).
The changes will take effect from 1997 and we estimate the effect on public sector net borrowing to range from increases of £0.6 billion to decreases of £1.2 billion, with the larger changes visible in earlier years.
Funded public sector pension schemes
Methods for estimating Local Government Pension Scheme (net) liability (AF.64) and associated imputed flow (D.612) were reviewed and new estimates produced. We have also reviewed several other large funded public sector pension schemes to identify cases whereby government should be considered the pension manager. As a result, new methods and data sources have been used to quantify government’s net pension liability and associated flows for these schemes.
In the public sector finances, these changes will take effect from 1997. Data are not yet final, however, based on current estimates; we are expecting changes to public sector net borrowing to range from increases of £0.4 billion to decreases of £0.9 billion. For the financial year ending March 2015, the most recently available data, there is approximately a fall in public sector net borrowing of £0.7 billion. There are no effects on public sector net debt as pension liabilities are not included in the measure.
A more detailed article on these pension changes will be published alongside the public sector finances bulletin published in September 2017.
Housing associations
Although implemented in public sector finances in January 2016, September 2017 will see the reclassification of English private registered providers of social housing (referred to here as housing associations), recorded in the UK National Accounts for the first time.
The work for national accounts identified minor inconsistencies in our original data sources, which have now been resolved. These improvements will also be applied to the public sector finances and in doing so affect our measures of public sector net debt (PSND), public sector net borrowing (PSNB) and public sector net cash requirement (PSNCR) from July 2008 to date.
A methods article describing the implementation of the reclassification of English housing associations into the UK National Accounts was published on 5 June 2017. The article includes the effect of the change on PSNB and PSND for financial years ending March 2009 to March 2012. As a result of taking on these improvements to the implementation of this reclassification, public sector net debt will be increased by around £1.8 billion at the end of March 2012. Most of the improvements in data sources are for these early years, so revisions to public sector finance measures will be lower for recent years.
In both national accounts and public sector finances, English housing association data beyond the financial year ending March 2016 are based on Office for Budget Responsibility (OBR) forecasts and so estimates for this period will not be affected by these changes.
General government aggregates are not affected by these improvements in any periods.
Gross Fixed Capital Formation
These improvements will include updated estimates for gross fixed capital formation (GFCF), specifically with regard to estimates for the cost of transfer of fixed assets (such as legal costs incurred at point of sale of a property) and the net acquisition of entertainment, literary and artistic originals (such as film and TV recordings).
The first of these improvements removes existing negative estimates of transfer costs in national accounts for the public corporations sector as public corporations data sources already include expenditure on costs of transfer. Fiscal aggregates for the financial year ending March 2015 onwards (either net investment or net borrowing) were previously adjusted to remove these costs and so are not affected by this change. However, there will be revisions for earlier financial years.
The second of these improvements is expected to affect the public corporations sub-sector by both increasing net investment and decreasing current budget deficit by equal and offsetting amounts (expected to be less than £0.5 billion) in recent years, with no effect, therefore, on public sector net borrowing. It will not affect general government estimates.
We have published an article National Accounts articles: Impact of Blue Book 2017 changes on current price gross domestic product estimates, 1997 to 2012 explaining these methodological improvements in more detail.
Other changes to the next release that will be implemented in national accounts in due course
Immigration Skills Charge
In April 2017, the government introduced The Immigration Skills Charge, levied on employers of non-EEA migrants who apply under Tier 2 (General) or Tier 2 (Intra-company Transfer) for a visa to work in the UK. The levy has been set at £1,000 per employee per year, and a reduced rate of £364 for small or charitable organisations.
This charge impacts employers across the public and private sectors, and has been classified by ONS as a tax on production collected by Central Government.
Any additional central government income has the effect of reducing central government net borrowing (CGNB) and subsequently public sector net borrowing (PSNB).
An exemption to the charge will mean that it won’t apply to PhD-level jobs and international students switching from student visas to working visas.
This tax will be included within public sector finances at the earliest opportunity.
Rail for London
We plan to implement the reclassification of Rail for London (RfL) from the local government sector to the public corporations sector. This change will take effect from April 2011 to date.
Tube Lines Ltd
We are currently investigating whether revenue received by Tube Lines Ltd, which is classified to the local government sector, should be included in the category payments for non-market output.
If it were included, local government net borrowing and therefore public sector net borrowing would be reduced with effect from April 2009 by between £0.4 billion and £0.6 billion per financial year. We aim to complete our investigation by early September 2017 and implement any improvements arising from this investigation at the earliest opportunity thereafter.
Green Investment Bank
On 20 April 2017, the government announced the sale of Green Investment Bank (GIB plc) to Macquarie Group Limited. The sale was completed in August 2017, when the government will receive £1.8 billion. As with similar share sales, the proceeds will reduce the central government net cash requirement (CGNCR) and public sector net debt (PSND) by an amount corresponding to the cash raised from the sale, but have no effect on public sector net borrowing.
A decision on the future classification of GIB plc will be announced in due course.
Back to table of contents13. Quality and methodology
The public sector finances Quality and Methodology Information report contains important information on:
- the strengths and limitations of the data and how it compares with related data
- uses and users of the data
- how the output was created
- the quality of the output including the accuracy of the data
UK Statistics Authority assessment of public sector finances
On 20 June 2017, the UK Statistics Authority published a letter confirming the designation of the monthly public sector finances bulletin as a National Statistic. This letter completes the 2015 assessment of public sector finances.
In order to meet the requirements of this assessment we published an article, Quality assurance of administrative data used in the UK public sector finances. This report provides an assessment of the administrative data sources used in the compilation of the public sector finances statistics in accordance with the UK Statistics Authority’s Administrative Data Quality Assurance Toolkit.
How classification decisions are made?
Each quarter we publish a forward workplan outlining the classification assessments we expect to undertake over the coming 12 months. To supplement this, each month a classifications update is published, which announces classification decisions made and includes expected implementation points (for different statistics) where possible.
Classification decisions are reflected in the public sector finances at the first available opportunity and, where necessary, outlined in this section of the statistical bulletin.
The Monthly statistics on the public sector finances: a methodological guide was last updated in August 2012. We are currently working to update this publication in 2017.
Supporting documentation
Documentation supporting this publication is available in appendices to the bulletin.
- Appendix A – Public sector finances Tables 1 to 10
- Appendix B – Large impacts on public sector fiscal measures excluding financial intervention (one-off events)
- Appendix C – Revisions analysis on several main components of the central government account (current receipts, current expenditure, net borrowing and net cash requirement)
- Appendix D – Public sector current receipts table
- Appendix E – Impact of the reclassification of housing associations into the public sector: the financial year ending March 2009 to the financial year ending March 2017
- Appendix F – Supplementary fiscal measures
- Appendix G – Revisions to the first reported estimate of financial-year-end public sector net borrowing (excluding public sector banks) by sub-sector
Public sector borrowing by sub-sector
Each month, at 9.30am on the working day following the public sector finances statistical bulletin, we publish Public sector finances borrowing by sub-sector.This release contains an extended breakdown of public sector borrowing in a matrix format and also estimates of Total Managed Expenditure (TME).
Back to table of contents14. Tell us what you think
About sub-regional public sector finances
The Sub-national public sectors finances (PSF) consultation aims to gather user views on public sector finance statistics at local area geographies, whether that be country, region, local authority or other sub-UK geography.
It is related to two recent Office for National Statistics (ONS) publications: the Country and regional public sector finances bulletin and the Sub-regional public sector finances scoping study. The consultation opened on 3 July 2017 and closes on 11 September 2017.
We are looking forward to hearing your views and working together further to improve our sub-national public sector finance statistics.
About this bulletin
As part of our continuous engagement strategy, we welcome your feedback on ways in which this bulletin can be improved. Please email us at public.sector.accounts@ons.gov.uk with your views.
Back to table of contents