
1. Introduction
This article provides analysis specific to public service healthcare productivity for England and on a financial year basis. This additional analysis is included to provide a measure more comparable with other data available on the health service in England. Released alongside this article is a larger healthcare productivity article produced on the traditional UK calendar year basis with more detail on how the measure is produced, as well as the annual UK total public service productivity estimates:
Back to table of contents2. Main points
In financial year ending (FYE) 2017, healthcare productivity grew by 3.0% as output growth of 3.6% exceeded input growth of 0.6%.
Healthcare productivity increased by just over 25% between FYE 1996 and FYE 2017, with most of this increase occurring since FYE 2010.
Growth in healthcare inputs has slowed from an average of 5.3% annually in the 2000s to an average of 1.9% over the 2010s.
Healthcare quantity output was 2.5 times higher in FYE 2017 than in FYE 1996, although output growth has slowed since FYE 2010.
The quality adjustment added an average 0.5 percentage points to output growth since it was introduced in FYE 2001.
3. Things you need to know about this release
This article gives an overview of the drivers of change in public service healthcare productivity in England in financial year ending (FYE) 2017 and analyses changes in inputs and output over the course of the series FYE 1996 to FYE 2017.
The methodological basis for these statistics is the same as for the UK publication and the data used are largely those used to produce the inputs and output for England in the UK measure. More information on the methodology used can be found in Public service productivity: healthcare, UK, 2016, while more information on the similarities and differences between the England and UK measures can be found in Section 7: Comparison of public service productivity estimates for England and the UK.
It should be noted that differences between the England and UK productivity measure cannot be used to estimate healthcare productivity for the devolved administrations. This is because, while data from the devolved administrations are used to produce the UK productivity series, there are differences in the coverage of the data, and some elements of devolved administration output and inputs are imputed based on data from England or the group of UK nations for which data are available.
Back to table of contents4. Inputs
Inputs in the public service healthcare productivity measure are measured in volume terms and consist of three components:
labour, or staff inputs
goods and services purchased by the health service for use in providing healthcare
capital consumption, the cost of depreciation of capital goods over time
More information on how inputs are measured can be found in the accompanying publication, Public service productivity: healthcare, UK, 2016.
Goods and services inputs fell for the first time in the series in FYE 2017, while labour inputs continue to grow steadily
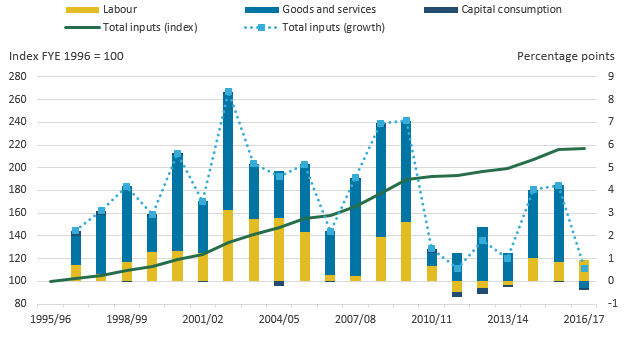
Figure 1a shows the growth in the two main components, labour, and goods and services inputs.
Figure 1a: Public service healthcare inputs quantity growth by component, England, financial year ending (FYE) 1996 to FYE 2017
Source: Office for National Statistics
Notes:
Figure 1a shows the inputs growth by component before it is weighted by expenditure share.
Capital consumption growth was not included in figure 1a, due to its small expenditure weight, and therefore small impact on total inputs (see figure 1b).
Download this chart Figure 1a: Public service healthcare inputs quantity growth by component, England, financial year ending (FYE) 1996 to FYE 2017
Image .csv .xlsGoods and services inputs fell by 0.6% in financial year ending (FYE) 20171, the first fall in goods and services inputs recorded in the series. The fall in goods and services inputs in 2017 contrasts strongly with the growth of this component in the previous year of 6.8%, which was above the average rate of 6.4% observed over the whole period FYE 1996 to FYE 2017.
Four main factors were behind the fall in goods and services inputs in FYE 2017:
slower growth in purchases of care from non-NHS providers
a fall in agency staff expenditure
slower growth in the goods and services expenditure of NHS providers
stronger inflation in NHS inputs costs, which reduces the volume of inputs that can be purchased with any given amount of expenditure
These are the same factors that are behind the fall in goods and services inputs in the UK productivity measure and are discussed in more detail in Section 5 of Public service productivity: healthcare, UK, 2016.
In FYE 2017, labour inputs grew by 2.0%, in line with an average growth rate over the whole period FYE 1996 to FYE 2017, and similar to the previous year’s growth rate of 1.7%.
Growth in labour inputs in FYE 2017 was due to increases in full-time equivalent staff numbers across a range of staff groups. Consistent with recent years, the largest contribution to labour inputs growth from any single staff group came from consultants2, where full-time equivalent staff numbers increased by 3.4% in FYE 2017. There were also substantial contributions to labour growth from the other large staff groups, including support to clinical staff; scientific, technical and therapeutic staff; and nursing staff. However, it is notable that full-time equivalent (FTE) nursing staff numbers grew by only 0.7% in FYE 2017, less than the 2.2% growth of the total NHS workforce. FTE numbers for some staff groups fell in FYE 2017, such as general practitioner numbers, which fell by 0.7%.
Not all workers in the NHS are included in the labour inputs measure. Agency staff are included in the goods and services element of inputs as agency workers are not employees of the health service and no direct measures of agency staff numbers exist. Expenditure on agency workers fell in FYE 2017 after four consecutive years of growth. This fall followed the introduction of a cost-per-hour cap on agency staff introduced in the English NHS in November 2015 and extended to all staff categories in April 2016.
Due to data limitations, bank staff, who work flexible hours and are typically used as an alternative to agency staff contracted from private staffing agencies, are excluded entirely from the inputs measure. It is possible that the combination of the aforementioned agency staff pay cap and an NHS Professionals campaign, launched in 2016, to encourage nurses to join staff banks, may have increased total staff inputs by more than the data used in this publication can measure.
In FYE 2017, healthcare inputs growth slowed due to the fall in goods and services inputs. Figure 1b shows the contribution to the overall growth rate made by each of the three inputs components.
Figure 1b: Public service healthcare contributions to inputs growth by component, England, financial year ending (FYE) 1996 to FYE 2017
Source: Office for National Statistics
Notes:
- Figure 1b shows the inputs growth by component after weighting by their share of total expenditure.
Download this image Figure 1b: Public service healthcare contributions to inputs growth by component, England, financial year ending (FYE) 1996 to FYE 2017
.PNG (27.3 kB) .xlsx (12.2 kB)
The contribution of each element to inputs growth depends on both the growth rate of that element and its share of total expenditure. Over the period covered by the series, both goods and services and labour inputs have had large shares of expenditure and seen substantial growth, and as a result have made large positive contributions to overall inputs growth. Due to its small share of expenditure, capital consumption has had a minor effect on overall inputs growth over the period.
Figure 1b shows that inputs grew by only 0.6% in FYE 2017. This was as a result of the first fall in goods and services inputs in the series, although overall inputs growth was still positive due to the positive contribution of labour inputs more than offsetting the negative contribution of goods and services inputs. Capital consumption also reduced inputs growth in FYE 2017 although its effect was relatively small due to its small share of expenditure.
Growth in healthcare inputs has slowed from an average of 5.3% annually in the 2000s to an average of 1.9% over the 2010s
Total healthcare inputs increased by an average annual rate of 3.8% between FYE 1996 and FYE 2017, resulting in healthcare inputs being 2.2 times greater in FYE 2017 than in FYE 1996.
Over this period, goods and services inputs contributed the largest share of inputs growth. This is in part due to two elements that are also included in output, and so have a minimal effect on productivity. These elements are: non-NHS provision, which is included on this basis due to the absence of activity data, and General Practitioner (GP)-prescribed drugs, which are simultaneously considered both an input and an output. These series also recorded faster growth than other output elements over the period and more analysis on these is available in Section 5 on Output.
This growth rate has varied over time and slowed markedly after FYE 2010, with an average growth of 5.3% over the 2000s and an average growth of 1.9% since FYE 2010, with lower growth in all three inputs components. The slower inputs growth is due largely to lower growth in real terms spending3 on healthcare.
Notes for: Inputs
Growth rates for a single year are given as the growth between the stated year and previous year. For example, the growth figure for FYE 2017 is the growth measured between FYE 2016 and FYE 2017. Growth rates for a period of more than one year are given as the growth between the first and the last year in that period. For example, growth between FYE 2015 and FYE 2017 represents growth between the level of a series in FYE 2015 and its level in FYE 2017.
Further analysis on the productivity of consultants is available from the Health Foundation.
Further information on NHS spending over time is available from Full Fact and the Institute for Fiscal Studies.
5. Output
Healthcare output is measured as the quantity of healthcare provided, adjusted for the quality of delivery. Quantity output is estimated using a cost-weighted activity index, where the growth rates of individual activity types are weighted by the share of expenditure that activity type accounts for. Due to this approach, growth in treatments that are high volume and expensive has a greater effect on overall output than a similar rate of growth in treatments that are uncommon or low cost. A quantity of healthcare is estimated for each of the following sectors:
Hospital and Community Health Services (HCHS)
Family Health Services (FHS) – includes General Practitioner (GP) and practice nurse consultations, publicly funded dental treatment and sight tests
GP-prescribed drugs
non-NHS provision – includes healthcare funded by the government but provided by the private or third sector
A quality adjustment reflecting the extent to which the service succeeds in delivering its intended outcomes and the extent to which the service is responsive to users’ needs, is applied to the estimate of healthcare quantity output. More information on the methodology used to measure healthcare output can be found in the accompanying article, Public service productivity: healthcare, UK, 2016.
Growth in NHS HCHS output increased slightly in FYE 2017, while output growth for non-NHS provided services slowed
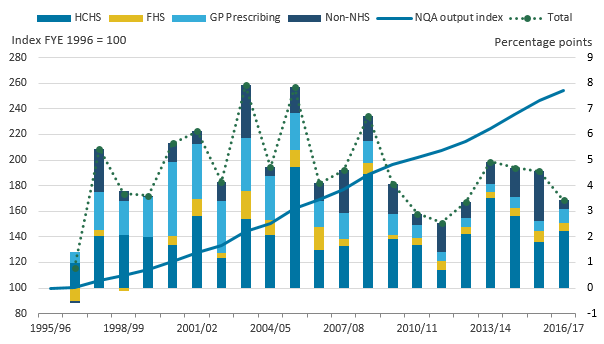
Figure 2a: Public service healthcare quantity output growth by component, England, financial year ending 1996 to FYE 2017
Source: Office for National Statistics
Notes:
HCHS – Hospital and Community Health Services.
FHS – Family Health Services.
Download this chart Figure 2a: Public service healthcare quantity output growth by component, England, financial year ending 1996 to FYE 2017
Image .csv .xlsGrowth in HCHS increased from 2.9% in financial year ending (FYE) 2016 to 3.6% in FYE 2017, matching the average of the entire series. This stronger growth was due to increases in a range of activity types, with an increase in outpatient consultations a substantial factor. However, the largest area of HCHS activity by expenditure, inpatient activity, grew at a similar rate in FYE 2016 and FYE 2017, with a small increase in non-elective activity growth and a small decrease in elective activity growth largely cancelling each other out.
Figure 2a shows that publicly funded healthcare output from non-NHS providers grew by 2.8% in FYE 2017, the slowest growth in this component since FYE 2000. This followed exceptionally strong growth in this component in FYE 2016 of 17.3%. Non-NHS provision has seen faster growth in earlier years in the series, although it should be noted that earlier in the series non-NHS provision accounted for a relatively small share of expenditure and so the very high growth rates seen for non-NHS provision in FYE 1998 and FYE 2004 do not necessarily translate into exceptionally large absolute increases in healthcare output.
As many of the services provided by non-NHS providers, such as community health services and routine day case procedures, are also carried out by NHS providers, it may be that there is a correlation between faster growth in NHS-provided HCHS services and slower growth in non-NHS services. In this case, the relative growth rates of each component will partly depend on changes in the proportion of such treatment carried out by NHS and non-NHS providers. However, an absence of detailed data on the services provided by non-NHS providers limits the opportunity for further analysis of this component.
For the final components of output, GP-prescribed drugs grew at 5.8% in FYE 2017, slightly faster than in the previous year, while Family Health Services grew slightly more slowly in FYE 2017, but remained similar to the trend for recent years.
In FYE 2017, total quantity output growth slowed, due mainly to lower growth in non-NHS provision
Figure 2b shows the effect of the four components of quantity output on total quantity output. As total quantity output is produced by weighting together the components by their share of total expenditure, the effect on output of each component depends both on its growth rate and share of expenditure.
Figure 2b: Public service healthcare contributions to quantity output growth by component, England, financial year ending (FYE) 1997 to FYE 2017
Source: Office for National Statistics
Notes:
- HCHS – Hospital and Community Health Services.
- FHS – Family Health Services.
- The sum of components of quantity output may not equal total output due to rounding.
Download this image Figure 2b: Public service healthcare contributions to quantity output growth by component, England, financial year ending (FYE) 1997 to FYE 2017
.PNG (29.8 kB) .xlsx (11.5 kB)
In FYE 2017, quantity output grew by 3.4%, which is slower than the previous year and the average of the series of 4.6%.
Figure 2b shows this lower growth is due primarily to slower growth in non-NHS output. Figure 2b also shows that just over three-quarters of quantity output growth in FYE 2017 was due to HCHS.
While the lower growth in overall quantity output in FYE 2017 is more similar to the low growth observed during the period FYE 2010 to FYE 2013, growth in HCHS remains higher than in most of this earlier period.
Quantity output growth during the 2010s was lower than during the 2000s, due largely to lower growth in GP-prescribed drugs
Quantity output growth averaged 5.6% between FYE 2000 and FYE 2010 and 3.8% between FYE 2010 and FYE 2017. The main source of this slowdown was GP-prescribed drugs, which saw slowing output growth across the period and contributed 1.2 percentage points of this 1.8 percentage points reduction in growth. All three of the other components of quantity output also saw slower growth in the 2010s than in the 2000s, although for the largest component, HCHS, the reduction was small, with average annual growth slowing from 4.1% between FYE 2000 and FYE 2010 to 3.4% between FYE 2010 and FYE 2017.
Figure 2b displays total growth in output over the series, showing that quantity output was over 2.5 times higher in FYE 2017 than in FYE 1996.
Quality adjustment added 0.2 percentage points to output growth in FYE 2017, less than the series average
Figure 3 shows the effect on output of adjusting for changes in healthcare quality. The quality adjustment used incorporates a range of factors covering short-term post-operative survival rates, the estimated health gain from inpatient treatment, waiting times, patient satisfaction and primary care outcomes. More information about the quality adjustment can be found in Public service productivity: healthcare, UK, 2016 and Quality adjustment of public service health output: current method.
Figure 3: Public service healthcare quantity and quality-adjusted output indices and growth rates, England, financial year ending (FYE) 1996 to FYE 2017

Source: Office for National Statistics
Notes:
- QA - quality adjusted.
- No quality adjustment is currently applied to non-NHS services.
Download this image Figure 3: Public service healthcare quantity and quality-adjusted output indices and growth rates, England, financial year ending (FYE) 1996 to FYE 2017
.PNG (27.9 kB) .xlsx (11.6 kB)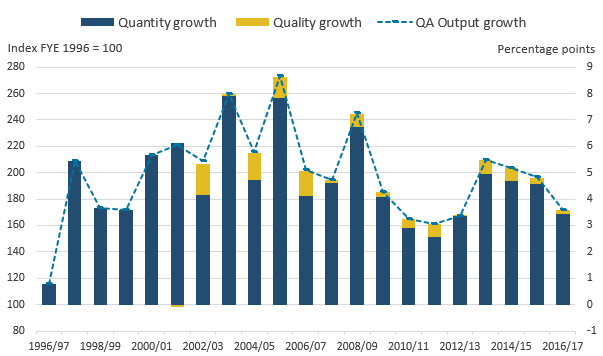
In FYE 2017, the quality adjustment added 0.2 percentage points to the output growth rate, below the previous year's growth of 0.3 percentage points and the average quality adjustment growth for the series of 0.5 percentage points. As the data for the healthcare quality adjustment are only available for England, the same quality adjustment is applied in both the England and UK series, although the figures will differ depending on whether they are reported on a financial year or calendar year basis.
Back to table of contents6. Productivity
Public service healthcare productivity is estimated by comparing output and inputs growth. If output growth exceeds inputs growth, productivity increases, meaning that more output is being produced for each unit of input. Conversely, if inputs growth exceeds output growth, then productivity will fall.
In FYE 2017, productivity growth rebounded to 3.0%, as output growth slowed by less than input growth
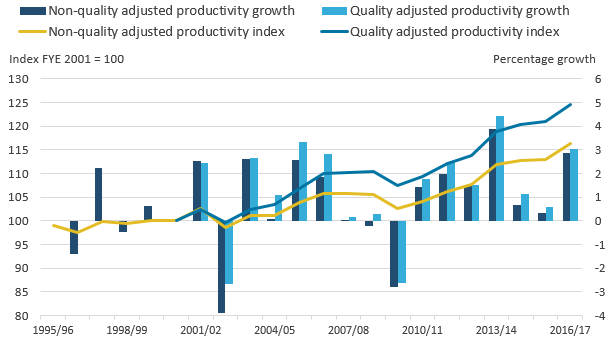
Figure 4 shows the growth of healthcare productivity with and without the quality adjustment applied, with total growth indexed to financial year ending (FYE) 2001, the year before the quality adjustment was introduced.
Figure 4: Public service healthcare quantity and quality-adjusted productivity indices and growth rates, England, financial year ending (FYE) 1995 to FYE 2017
Source: Office for National Statistics
Download this image Figure 4: Public service healthcare quantity and quality-adjusted productivity indices and growth rates, England, financial year ending (FYE) 1995 to FYE 2017
.PNG (24.3 kB) .xlsx (10.7 kB)
As a result of output growth slowing less than inputs growth, non-quality adjusted productivity grew by 2.9% in FYE 2017. This was higher than the 0.3% growth recorded in FYE 2016 and the average growth rate since FYE 1996 of 0.8%.
Quality-adjusted productivity increased by 3.0% in FYE 2017, faster than non-quality adjusted productivity because of a positive quality adjustment, indicating improved service quality. Quality-adjusted productivity growth in FYE 2017 was also faster than the average growth rate of 1.1% for the series since FYE 1996.
Quality-adjusted productivity increased by 25.9% over the series, with most of this increase occurring since FYE 2010
Over the series, quality-adjusted productivity grew by 25.9%, while non-quality adjusted productivity increased by 17.4%.
However, this increase was not continuous over the period and there are a few changes in the trend over the series:
between FYE 1996 and FYE 2003, the productivity level was largely unchanged, although it should be noted that there was no quality adjustment to this measure until FYE 2002
between FYE 2003 and FYE 2007, productivity increased by an average annual rate of 2.5%, due partly to strong growth in quality
productivity growth nearly halted in FYE 2007 and fell in FYE 2010, a year of strong inputs growth, but slower Hospital and Community Health Services (HCHS) output growth
Since FYE 2010, the average rate of inputs and output growth have both reduced, but output growth has not decreased as much as inputs growth, resulting in productivity growth in each of the last seven years of the series. While it accounts for only one-third of the period covered by the series, the period from FYE 2010 onwards accounts for two-thirds of the total productivity growth since FYE 1996 for the quality-adjusted measure and an even higher share of growth in the non-quality adjusted measure.
Back to table of contents7. Comparison of public service healthcare productivity estimates for England and the UK
Figures for public service healthcare productivity were introduced in 2018, to provide a further measure to healthcare policy analysts, which is on a more consistent basis with other statistics that cover the English NHS, where financial data are typically reported on a financial year basis (that is, 1 April to 31 March) . The England financial year productivity measure differs from the UK calendar year productivity measure in the following ways:
quantity output is restricted to output from England only
the labour, and goods and services components of inputs are restricted to England only
many of the data sources used by Office for National Statistics (ONS) are created on a financial year basis, and a process called “cubic splining” is used to produce the calendar year measures; however, this process is not carried out in the production of this England only, financial year measure
However, to maintain the methodological consistency with the UK productivity estimates, a number of data sources remain unchanged:
it is not possible to disaggregate the national accounts capital consumption data to a sub-UK level, so UK data continue to be used for this component
the three inputs components – labour, goods and services, and capital consumption – have been weighted together to form the total inputs index using UK-level data from the national accounts; this means that the proportion of total inputs made up of each of the three components is the same in both the UK and England series
in the UK healthcare productivity series, the quality adjustment to output is produced using England-only data, but is applied to UK output; while in the England financial year productivity series, the same quality adjustment is used, but is applied to England output only
Due to these changes, the England financial year healthcare productivity measure provides a better estimate for measuring the productivity of the English health system, while the UK calendar year productivity measure remains more suitable for measurement at a UK level3 and continues to be used as a component of total public service productivity.
It should, however, be noted that differences between the England and the UK productivity measure cannot be used to estimate healthcare productivity for the devolved administrations. This is because, while data from the devolved administrations are used to produce the UK productivity series, there are differences in the coverage of the data, and some elements of devolved administration output and inputs are imputed based on data from England or the group of UK nations for which data are available.
Notes for: Comparison of public service healthcare productivity estimates for England and the UK
While the Centre for Health Economics at the University of York already produces a measure of healthcare productivity for England, there are a number of differences in the data sources and methods used, which are detailed in Section 10 of Public service productivity: healthcare, UK, 2016.
Cubic splining involves the imputation of quarterly data based on trends in data over multiple financial years and constructs a calendar year figure based on these imputed quarterly figures.
In the calculation of the UK healthcare productivity statistics, the labour, goods and services, and output series for the constituent nations of the UK are weighted together using healthcare expenditure data from HM Treasury’s Country and regional analysis. Goods and services inputs for Northern Ireland are currently imputed based on the rate of goods and services inputs growth from the rest of the UK.