1. Background
In addition to estimates of quarterly labour productivity for the UK, the Office for National Statistics produce annual estimates of labour productivity for the UK regions. These estimates – derived for the Nomenclature of Units for Territorial Statistics (NUTS1) regions – use annual estimates of gross value added (GVA) sourced from the regional accounts and annual estimates of labour input to calculate labour productivity.
In light of the renewed interest in regional policy and following feedback from stakeholders, we have been working to improve the range of regional productivity data that we publish. In January 2017, we published updated estimates of labour productivity on a regional basis, at the NUTS1, 2 and 3 levels. In April 2017, we published experimental estimates of quarterly regional labour input on a consistent basis with equivalent UK-level metrics. In this release, we are further expanding this set of experimental statistics to include industry-by-region labour productivity metrics on an annual basis. These experimental estimates – which detail productivity jobs and hours as well as the corresponding labour productivity measures for letter-level industries for each NUTS1 region – are published alongside this article. This improvement in the granularity of labour metrics and productivity measures at the NUTS1 level should allow more detailed analysis of productivity at the regional level, and is part of a broader work-programme that we are carrying out in the area of productivity.
This note introduces these experimental data and provides some high-level analysis of industry-by-region labour input and labour productivity. The first section outlines the methodology that we use to estimate these series and highlights a range of limitations of these data that users should be aware. The second section presents some of the main findings from these data.
As with all of our productivity outputs, we welcome user views on the possible uses and usefulness of these data. This is particularly relevant for these experimental statistics. Please provide any feedback via email to Productivity@ons.gov.uk.
Back to table of contents2. Methodology
The new estimates published in this release detail labour productivity by industry and region on an output per hour and output per job basis for the period 1997 to 2015. Three components are needed to calculate these measures: regional gross value added (GVA) by industry; regional jobs by industry; and average hours broken down by region and industry. Of these components, regional GVA and regional jobs by industry are relatively straightforward to compute either from existing published sources or from the inputs to the existing labour productivity system. Estimating the final component – average actual hours worked on an industry by region basis – is more complex. This section sets out the sources and methods used to generate these three components and sets out some of the limitations that these methods impose on the resulting estimates.
Regional GVA
Our estimates of regional GVA are taken from the regional accounts, which draw on the Office for National Statistics' (ONS) structural business surveys, the Inter-Departmental Business Register (IDBR) and a range of other sources to estimate value added on an industry by region basis. These regional estimates are measured in terms of the location of economic activity and not on the basis of headquarter location. This measure of output is estimated in current prices and forms the numerator for the productivity measures presented in this release. These estimates are available on an annual basis between 1997 and 2015, which by extension is the time period covered by the productivity measures introduced in this article.
Regional jobs by industry
Regional jobs are calculated in the same way as the headline, UK-level official statistics, using the same data sources. Information on the number of employee jobs is primarily taken from the Short-Term Employment Survey (STES), the Business Register Employment Survey (BRES)1 and the Public Sector Employment Survey. Self-employed and unpaid family worker’s (UFWs) data are taken from the Annual Population Survey (APS), while Her Majesty’s Forces (HMF) data are taken from the Ministry of Defence (MoD) and government support and training (GST) data are taken from the Labour Force Survey (LFS). Employees and self-employed jobs are first constrained to the UK totals before being added to the remaining employment statuses. Similar to regional GVA, these estimates refer to the location of labour activity and as such are on a comparable geographic basis. The utilisation of these data sources yields a sample size large enough to produce regional jobs estimates split by industry.
Regional average hours by industry
By contrast, producing estimates of average actual hours worked on a region by industry basis is considerably more challenging. In order to generate these estimates, it is necessary to have a sample size large enough to provide quality average hours estimates for each of the 20 Standard Industrial Classification (SIC) letter industries in each of the 13 NUTS1 regions of the UK. For consistency with the national headlines, data are needed for each of these 260 combinations for both employees and self-employed jobs. Given the uneven distribution of workers, this presents a considerable challenge to the data collections used for the UK’s headline measures. The need to ensure a sufficiently deep sample on which to base estimates of region by industry average hours has consequently led us to consider estimates based on alternative data sources.
The Annual Survey of Hours and Earnings (ASHE) is an alternative source which we use to develop estimates of average hours on a region by industry basis. As well as having a larger number of unique respondents than the Labour Force Survey (LFS), ASHE also has the merit of being a survey of businesses about their employees – which is widely thought to avoid some problems of reporting bias and provide more accurate industry allocation, as well as a lower propensity to round reported hours.
However, using ASHE does present some issues compared with using the LFS – which is the primary source for employee average hours in the UK’s main labour productivity system. Firstly, ASHE measures paid usual hours as opposed to actual hours: this means that changes in overtime, leave or sickness – which are relevant for productivity metrics – are not captured by this source. Secondly, ASHE is an annual survey, corresponding to employment during April. This contrasts with the regional GVA data, which is measured on a calendar year basis. To ensure the quality and accuracy of the resulting labour productivity measures, both the numerator and denominator in the productivity ratio should be estimated over the same period. Thirdly, ASHE contains only data for employees. To address these constraints, we have developed an approach to arrive at an annual actual average hours worked figure from ASHE for each industry in each region.
The first step in this process is to adjust the paid usual hours recorded in ASHE to produce an estimate of actual hours worked. To do this, we use information from the LFS on workers’ usual and actual hours for each industry and region. We apply this relationship in a detailed manner to the records that we observe in ASHE, so as to convert the distribution of paid usual hours into an estimated distribution of actual hours.
To be more specific, we construct matrices that show the distribution of workers according to their actual and paid usual hours for each industry by region combination as reported on the LFS, smoothing this data over a three year window to ensure sufficient sample size. This gives us a matrix that shows the share of workers at each length of usual working week who actually work different length weeks. Figure 1 visualises a matrix of this form. In this depiction, the horizontal axis shows paid usual hours and the vertical axis shows actual hours, with brighter colours representing greater densities of observations with a given combination of actual and paid usual hours. Figure 1 indicates that in most cases actual and paid usual hours are close if not the same. However, there are a substantial number of observations for which paid usual hours are around 40 (full-time employees) but actual hours worked are zero, potentially indicating paid holiday, illness or some other leave in the reference week.
Figure 1: Labour Force Survey actual hours compared with paid usual hours heat map, UK

Source: Office for National Statistics
Download this image Figure 1: Labour Force Survey actual hours compared with paid usual hours heat map, UK
.png (92.2 kB) .xls (166.4 kB)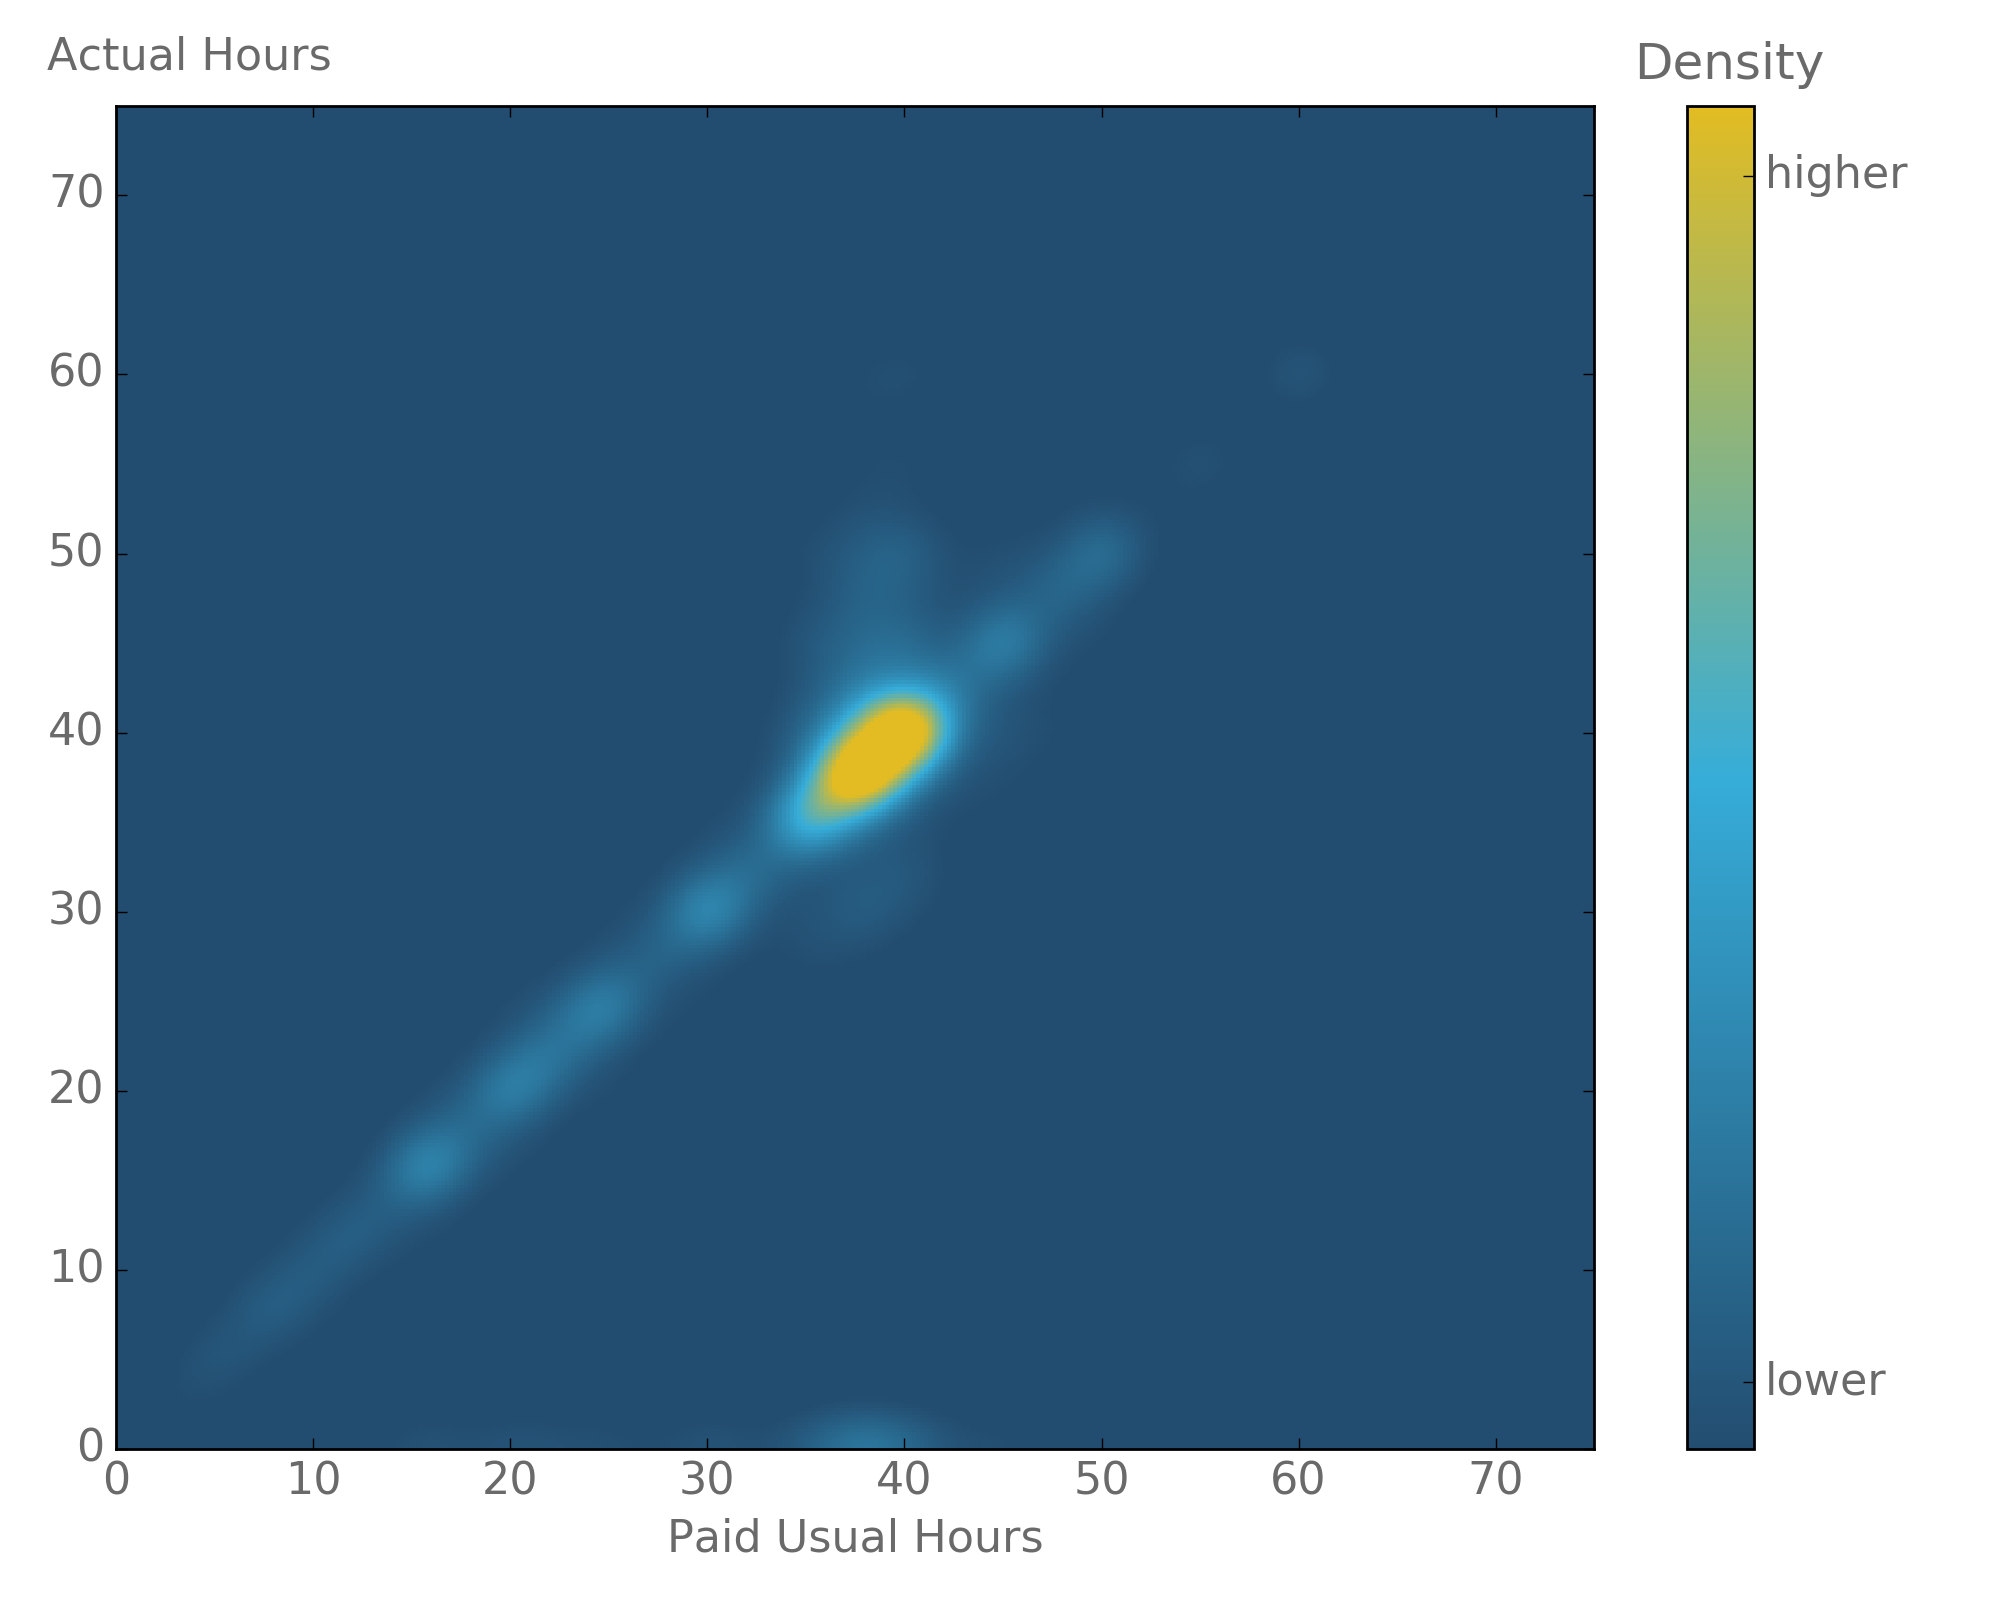
Having assembled matrices of this form for each industry by region, we return to the ASHE data. For each worker observed working a given “usual” week in a given industry by region combination in ASHE, we apply the shares calculated using the LFS, producing a distribution of “likely actual hours” for each individual. We subsequently aggregate these distributions for each industry and region, yielding a “synthetic” average actual hours worked number from ASHE for each industry, in each region, in each year2. The aggregation at the end of the process can be best explained through a simplified example (Example 1).
Example 1: Aggregation from individual records to ASHE distributions for each industry, in each region, in each year
For the sake of clarity, consider an industry by region combination in which there are just two individuals: A and B (Figure 2). We know from ASHE that individual A is paid for working a very long working week of 70 usual hours in a given industry, region and year. To estimate A’s “distribution of likely actual hours” we refer to the actual-usual hours matrix and identify the share of workers in this industry by region group, working a similar number of hours, who actually worked weeks of different lengths each period. This tells us (in this hypothetical example) that the most likely actual working week is close to 70 hours – worker A’s “usual week” – but that a range of actual hours worked is possible – reflecting patterns of leave taking among similar workers.
A similar process can be followed for worker B, who usually works a shorter 30 hours a week. As with individual A, the most likely outcome is close to 30 hours a week, but a range of possibilities exist reflecting the patterns of leave taking among workers in this industry-region combination at this time. Applying our analysis of the LFS in this example yields the two lower curves in Figure 2 – highlighting the “estimated likely actual hours” distribution for individual A and B.
The final step in this process is to estimate average hours for the region and industry combination. Aggregating the two curves for A and B together produces the single, industry distribution, from which an estimated average actual hours data point can be drawn.
Figure 2: Estimating actual hours from paid hours recorded in the Annual Survey of Hours and Earnings, UK

Source: Office for National Statistics
Download this image Figure 2: Estimating actual hours from paid hours recorded in the Annual Survey of Hours and Earnings, UK
.png (17.6 kB)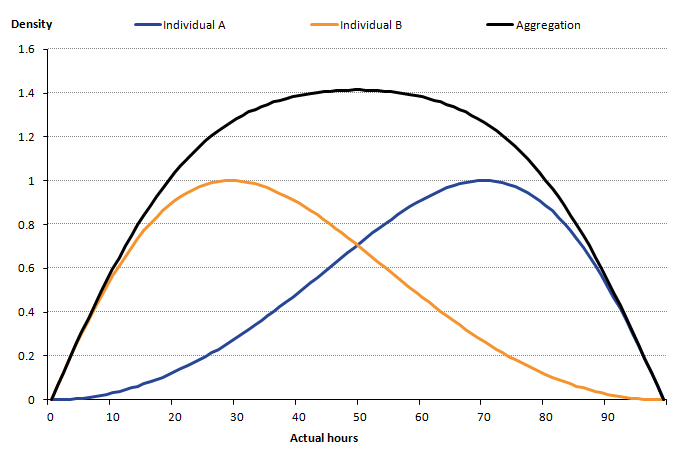
Having constructed estimates of average actual hours on an industry by region basis, the second step in this process is to convert the April ASHE figure into an annual average, again using the LFS3. This is done by dividing each synthetic ASHE average actual hours worked point by a seasonal factor - LFS Quarter 2 (Apr to June) divided by LFS annual - which is taken as a five year average centred on the reference year. This seasonal factor represents how much higher or lower the average hours worked in Quarter 2 (Apr to June)4 are than that in the rest of the year for a given industry by region observation. For the beginning and end of the series where the average cannot be centred on the reference year, the five year average includes more years after or prior to the reference year.
The final step is the calculation of average hours figures for the self-employed and other employment statuses. For the self-employed the Annual Population Survey (APS) is utilised. The APS augments the LFS with additional data sources on an annual basis, resulting in a higher number of unique respondents. The same methodology is used as in official statistics, but using the APS rather than the LFS.
Other employment statuses, Her Majesty’s Forces (HMF), government support and training (GST) and unpaid family workers (UFW), are treated in the same way as for the UK as a whole. Members of HMF are allocated to “public administration and defence; compulsory social security” (SIC 2007 industry O) in their region, using the Ministry of Defence (MoD) as the data source. Both GST and UFWs are allocated across industries on an employee share basis in each region, using the LFS as the data source. For each of these data sources there is a regional component, which is used to accurately allocate observations to their correct region.
Limitations
There are a number of limitations associated with this method, which will be discussed further in this section.
Average hours can be volatile, hence data for non-manufacturing production (A, B, D, and E) and other services plus activities of households as employers (S and T) have been aggregated. Given the granularity of the data there are some industries in some regions for which there is limited activity, potentially leading to issues with data quality. For example, agricultural activity (A) in London is sparse given the urban nature of the region.
Since the regional GVA data are in current prices, these productivity estimates cannot be used to analyse relative labour productivity growth rates across industries and regions through time. Comparisons of this sort would reflect both changes in the volume of output relative to labour input, but would also capture changes in relative prices. Instead, these estimates should be seen as a snapshot of all the industries and regions for each given year and used to compare levels in a given period.
Regional GVA includes imputed rentals in real estate activities (L) which, while consistent with the national accounts, causes issues when conducting productivity analysis. Imputed rental is accrued from historically acquired capital assets (housing). Therefore, zero labour input is engaged in the production of imputed rental output and as such, a labour productivity measure for imputed rentals (or an industry dominated by them) can be misleading5. The productivity teams will attempt to produce industry by region estimates excluding imputed rentals in a future release, similar to the experimental regional and sub-regional productivity statistics released in January 2017.
We constrain the resulting jobs and total hours figures to both the non-seasonally adjusted (NSA) regional totals and the NSA UK industry totals.
In terms of comparisons with previously published data, there are broadly two avenues for comparison. First, one can aggregate the industries in each region to arrive at a productivity measure for each region as a whole and – due to constraint – these will match up to the previously published regional totals. Second, one can calculate UK industry totals by summing the industries across the regions. However, these will not match up exactly to any published data as UK industry productivity is published on a seasonally adjusted basis only.
Notes for: Methodology
Note that these data are collected on a local unit basis, allocating the employment of individuals to the industry of the establishment at which they work, rather than that of the reporting unit to which they are attached.
This approach to adjusting between paid and actual hours differs from the regression approach used in our new quality adjusted labour input (QALI) development article, though both exploit the same statistical properties of the underlying Labour Force Survey data.
Both sources used for labour input – LFS and ASHE – are on a place of work basis and as such produce estimates on a comparable geographic basis to regional GVA by industry and regional jobs by industry.
Note that here we use Quarter 2 from the LFS in the absence of an April LFS figure.
Although, imputed rental is a necessity when considering multi-factor productivity, which takes account of both capital and labour inputs in the growth accounting framework.
3. Main findings
Labour metrics by industry and region – jobs and hours
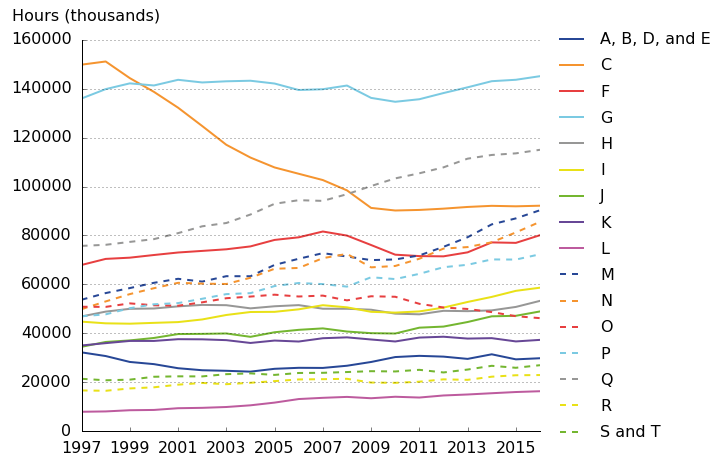
Applying the methodology outlined in section 2 yields industry-by-region labour metrics – jobs and hours – as well as productivity measures – output per hour and per job – for the letter level industries for each of the UK regions. Figure 3a shows jobs and Figure 3b shows total hours for the UK as a whole in each of the SIC letter industries. These provide some important background on UK industry trends that can then be further investigated by breaking the data down by region. Figures 3a and 3b show largely similar trends – reflecting broad similarities in average hours across regions. The observable level and trend variations between jobs and hours are a result of differences in average hours. The majority of industries experienced growth in jobs and hours over the period 1997 to 2016, with the highest growth rates occurring in real estate activities (L), administrative support and service activities (N), and professional, scientific and technical activities (M). The greatest reductions in labour input have taken place in manufacturing (C), with smaller falls observed in non-manufacturing production (A, B, D and E), public administration and defence (O), and financial and insurance activities (K).
Figure 3a: Jobs by industry, UK, 1997 to 2016

Source: Office for National Statistics
Notes:
A, B, D, and E – Non-manufacturing production (Agriculture, Forestry and Fishing, Mining and Quarrying, Electricity, gas, steam and air conditioning supply, Water supply, sewerage, waste management and remediation activities).
C – Manufacturing.
F - Construction.
G - Wholesale and retail trade; repair of motor vehicles and motorcycles.
H - Transportation and storage.
I - Accommodation and food service activities.
J - Information and communication.
K - Financial and insurance activities.
L - Real estate activities.
M - Professional, scientific and technical activities.
N - Administrative and support service activities.
O - Public administration and defence; compulsory social security.
P - Education.
Q - Human health and social work activities.
R - Arts, entertainment and recreation.
S and T - Other service activities, Activities of households as employers; undifferentiated goods- and services-producing activities of households for own use.
Download this image Figure 3a: Jobs by industry, UK, 1997 to 2016
.png (61.3 kB) .xls (24.1 kB)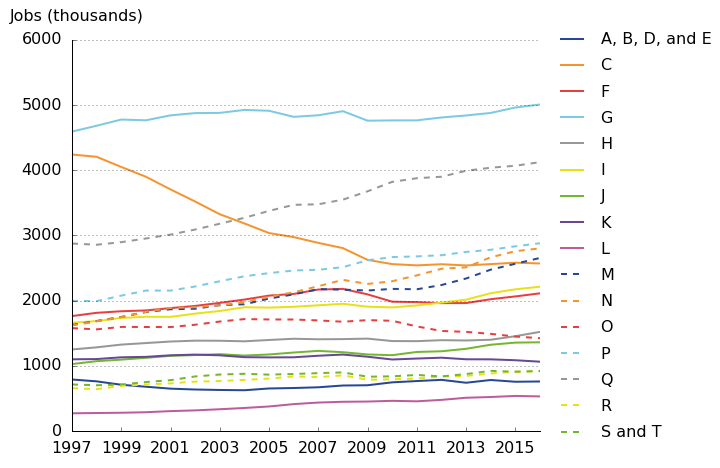
Figure 3b: Total hours by industry, UK, 1997 to 2016
Source: Office for National Statistics
Notes:
A, B, D, and E – Non-manufacturing production (Agriculture, Forestry and Fishing, Mining and Quarrying, Electricity, gas, steam and air conditioning supply, Water supply, sewerage, waste management and remediation activities).
C – Manufacturing.
F - Construction.
G - Wholesale and retail trade; repair of motor vehicles and motorcycles.
H - Transportation and storage.
I - Accommodation and food service activities.
J - Information and communication.
K - Financial and insurance activities.
L - Real estate activities.
M - Professional, scientific and technical activities.
N - Administrative and support service activities.
O - Public administration and defence; compulsory social security.
P - Education.
Q - Human health and social work activities.
R - Arts, entertainment and recreation.
S and T - Other service activities, Activities of households as employers; undifferentiated goods- and services-producing activities of households for own use.
Download this image Figure 3b: Total hours by industry, UK, 1997 to 2016
.png (72.8 kB) .xls (23.0 kB)
Focussing on the hours worked measure – which is the Office for National Statistics preferred measure of labour input as it takes into account both the number of jobs and working patterns in an industry – it is interesting to pick out some of the industry trends from Figures 3a and 3b, and explore these further at a regional level. Figure 4 highlights that the trend of falling total hours in manufacturing is reflected in all of the regions, with the majority of the reduction taking place between 1997 and 2009 before reaching a plateau during the post-downturn period. The largest falls in total hours in absolute terms came from the North West and the West Midlands, which lost 8,255,049 and 8,576,213 hours respectively over the period. However, the largest falls relative to their starting positions occurred in London and Scotland, with a 53% and 45% fall respectively over the period.
Figure 4: Total hours, manufacturing (C), NUTS1 regions, 1997 to 2016

Source: Office for National Statistics
Download this image Figure 4: Total hours, manufacturing (C), NUTS1 regions, 1997 to 2016
.png (77.1 kB) .xls (30.7 kB)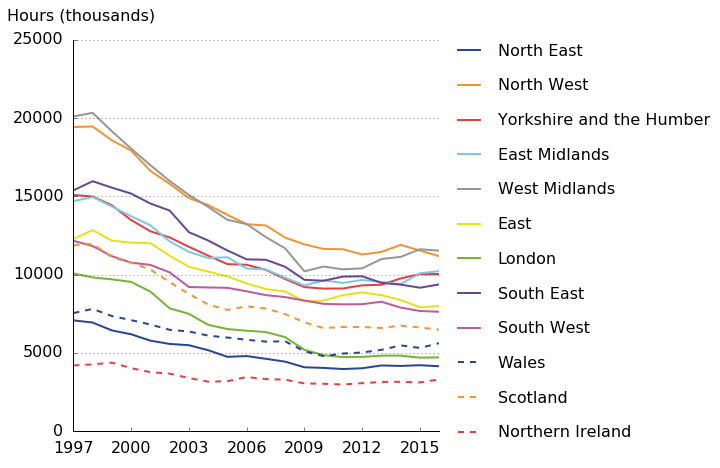
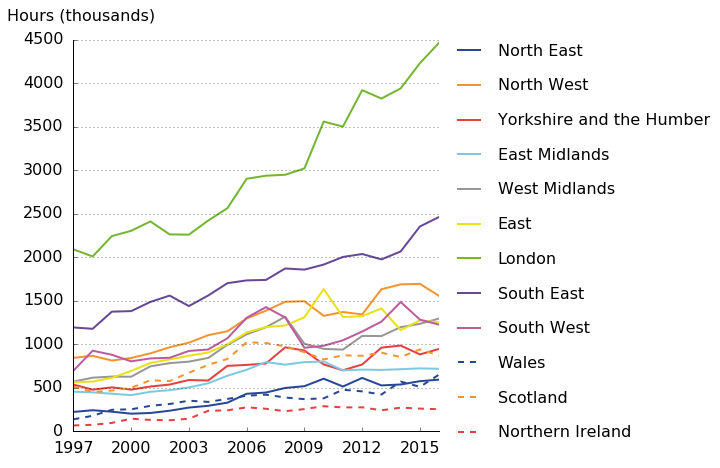
Turning to those industries with the largest increases in labour input, Figure 5 shows total hours in real estate for each of the NUTS1 regions in the period 1997 to 2016. Total hours in this industry grew in every region over the period, with London and the South East the largest components and main drivers. A similar picture exists for administrative activities and professional and scientific activities, the second and third fastest growing industries over the period.
Figure 5: Total hours, real estate activities (L), NUTS1 regions, 1997 to 2016
Source: Office for National Statistics
Download this image Figure 5: Total hours, real estate activities (L), NUTS1 regions, 1997 to 2016
.png (82.3 kB) .xls (30.7 kB)
Average hours
While the pre-existing annual productivity jobs and hours figures, and the new quarterly regional labour metrics published for the first time in April 2017 both enabled analysis of average hours worked by region, only these new data can support analysis of average hours by industry and region. Figures 3a and 3b highlights that while trends and levels of jobs and hours tend to be similar, there are differences which arise as a consequence of differences in average hours. The highest average hours in the UK occur in London and Northern Ireland at 33.5 hours and 33.2 hours per week respectively in 2016. At the more detailed, region by industry level, the highest average hours are worked in non-manufacturing production with an across region average of 39.2 hours per week. This holds when looking at all 192 industry-region combinations for 2016, with three of the top four greatest average hours for an industry-region combination being Welsh, Scottish and Northern Irish non-manufacturing production. These differences in regional average hours are influenced by the industrial make-up of a given region and the working patterns in that region, meaning both the variation in part-time and full-time split and the variation in average hours worked by part-time and full-time workers.
The importance of differences in average hours by industry are demonstrated by examining manufacturing (C) and wholesale and retail trade (G) – the two largest employers at the beginning of the period. Manufacturing jobs were 7.6% lower than wholesale and retail jobs in 1997, but total hours worked in manufacturing were 10.2% higher than in wholesale and retail over the same time period. This difference is explained by the difference in average hours between the two industries, with workers in manufacturing working on average 5.7 more hours per week than their retail counterparts.
Figures 6 and 7 break down these industry trends by region for the period 1997 to 2016. The levels of average hours, while volatile year-on-year, are similar across regions – with the exception of London and Northern Ireland. Average hours worked in manufacturing sit broadly between 33 and 37 hours, with most regions grouped together; only the average hours worked in London and Northern Ireland are higher than the other regions (Figure 6).
Figure 6: Average hours, manufacturing (C), NUTS1 regions, 1997 to 2016
Source: Office for National Statistics
Download this chart Figure 6: Average hours, manufacturing (C), NUTS1 regions, 1997 to 2016
Image .csv .xlsAverage hours worked in retail trade are similarly grouped together across regions, largely in the range 27 to 31 hours worked, again with the average hours worked in London and Northern Ireland higher than the other regions for much of the period (Figure 7).
Figure 7: Average hours, wholesale and retail trade (G), NUTS1 regions, 1997 to 2016
Source: Office for National Statistics
Download this chart Figure 7: Average hours, wholesale and retail trade (G), NUTS1 regions, 1997 to 2016
Image .csv .xlsLabour productivity by industry and region – output per hour
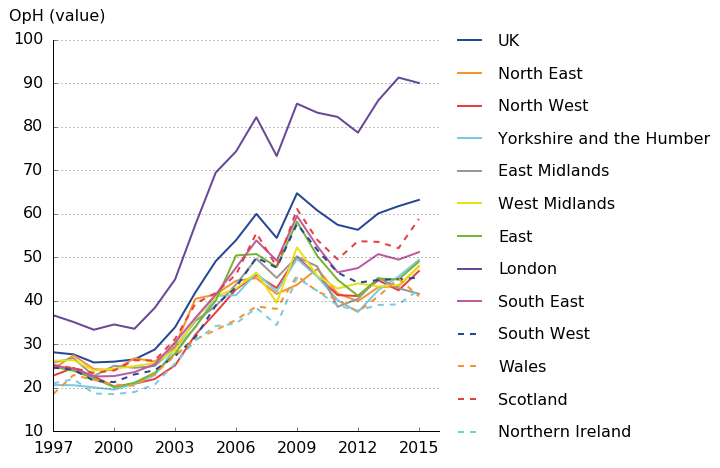
Moving on from labour metrics to industry by region productivity data, it is possible to observe how industry productivity varies at a regional level. Figure 8 shows the differing levels of labour productivity in the financial and insurance activities (K) industry. London is separated from the rest of the regions, with the level difference growing over the period. The financial crisis is notable in all regions, but the largest fall in level terms from 2007 to 2008 was that of London, which lost £8.92 in output per hour terms. Industry K is an extreme case within services, but is indicative of the industry-region trends presented by the data for the service industries more generally, with London sitting above the other regions and the South East and East often outperforming the majority.
Figure 8: Output per hour values, financial and insurance activities (K), NUTS1 regions, 1997 to 2015
Source: Office for National Statistics
Download this image Figure 8: Output per hour values, financial and insurance activities (K), NUTS1 regions, 1997 to 2015
.png (88.0 kB) .xls (32.3 kB)
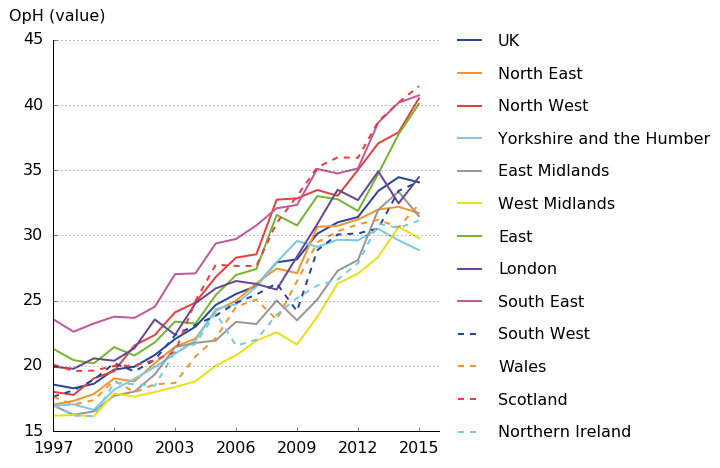
Outside of the services industries there exists substantial deviation from the trends shown in Figure 8. One such case is manufacturing (C), presented in Figure 9, where there is a closer grouping of regions and London is in the centre of the pack in the most recent periods. Towards the latter end of the period two groups start to form, with Scotland, the South East, the North West and the East showing substantially better performance than the other regions. Overall, one can observe a consistent upwards trend in productivity levels in all regions, driven at least in part by the falling hours observed in manufacturing across all regions.
Figure 9: Output per hour values, manufacturing (C), NUTS1 regions, 1997 to 2015
Source: Office for National Statistics
Download this image Figure 9: Output per hour values, manufacturing (C), NUTS1 regions, 1997 to 2015
.png (93.6 kB) .xls (32.3 kB)
To provide an overview of the relative levels of labour productivity across the UK, Figure 10 shows a snapshot from 2015 of the variation in productivity performance in manufacturing across regions. This highlights Scotland, the South East, the North West and the East as the most productive regions for manufacturing in output per hour terms, each with around £40 per hour worked. At the lower end, Yorkshire and the Humber and the West Midlands experienced performance closer to £30 per hour worked. Excluding real estate (L), non-manufacturing production (A, B, D, and E) had the greatest range of output per hour values, with around £61 between Northern Ireland and London. Similarly, finance (K) had a wide range, with the majority of regions grouped between £40 and £50, and with London at £90.07.
Figure 10: Output per hour values, manufacturing (C) across NUTS1 regions, 2015
Source: Office for National Statistics
Download this chart Figure 10: Output per hour values, manufacturing (C) across NUTS1 regions, 2015
Image .csv .xlsIndustry-region combination output per hour rankings, 2015
Focusing on the most recent year of data, there are 180 unique industry-region combinations (excluding real estate activities) each with their own output per hour value. Table 1 shows the top and bottom 10 industry-region productivity combinations. London’s financial and insurance activities (K) industry is the most productive and London’s non-manufacturing production (A, B, D, & E) industry takes second place, both with substantially higher labour productivity than any other industry-region combination. More broadly, four main industries make up the top three most productive industries in each region, those being non-manufacturing production (A, B, D, and E), manufacturing (C), information and communications (J), and financial and insurance activities (K). Finance and insurance activities ranks either first or second in all regions. This highlights that while London as a global financial hub is an important driver of industry K’s high productivity, ranked as the top combination in Table 1, it is not the only factor.
Table 1: Top and bottom 10 industry-region productivity combinations (excl. real estate)
| Rank | Industry | Region | Value |
| 1 | K | London | 90.07 |
| 2 | A, B, D, & E | London | 78.1 |
| 3 | K | Scotland | 58.78 |
| 4 | A, B, D, & E | North East | 56.08 |
| 5 | K | South East | 51.16 |
| 6 | J | London | 50.91 |
| 7 | J | South East | 50.63 |
| 8 | A, B, D, & E | South East | 49.82 |
| 9 | K | Yorkshire and the Humber | 49.38 |
| 10 | K | East | 48.95 |
| 171 | I | North East | 14.95 |
| 172 | I | South East | 14.88 |
| 173 | R | North East | 14.64 |
| 174 | N | East Midlands | 14.31 |
| 175 | R | South West | 14.28 |
| 176 | N | Northern Ireland | 14.09 |
| 177 | R | Northern Ireland | 13.96 |
| 178 | R | Yorkshire and the Humber | 13.77 |
| 179 | I | Wales | 13.6 |
| 180 | R | Wales | 12.35 |
| Source: Office for National Statistics | |||
| Notes: | |||
| 1. Real estate has been excluded from this table given that it yields the highest productivity figure in all of the NUTS1 regions. This occurs due to the inclusion of imputed rents in this industry, which while producing much output have no accompanying labour input. | |||
Download this table Table 1: Top and bottom 10 industry-region productivity combinations (excl. real estate)
.xls (27.1 kB)Among the industry by region combinations with the lowest levels of labour productivity, there are several noticeable trends. Wales, Northern Ireland and the North East account for two each of these groups, and these are drawn from just three broad industry groups – arts, entertainment and recreation (R), administrative and support service activities (N), and accommodation and food service activities (I). To some extent, these trends reflect the capital intensity of different industries. Non-manufacturing production, for instance, employs a large volume of capital relative to R, N and I, and this may help to explain these relative performances.
Back to table of contents4. Uses for these data and next steps
The development of an industry breakdown for the NUTS1 regions should enable users to do more detailed analysis than previously. In particular, these data support more detailed investigation of trends in labour input and labour productivity in particular industries at a regional level, using information about the jobs and hours worked in each UK NUTS1 region.
To what extent do differences in regional productivity reflect differences in industry breakdown? Are some regions systematically more or less productive across all industries, or does each have some specialisation in a specific industry? Are regional productivity differences in particular industries converging or diverging over time? These are all questions that can be approached with these data, and will be analysed further by the Office for National Statistics over the coming quarters.
The publication of these experimental series forms part of a wider work-programme that we have been pursuing in the area of productivity. As with all our outputs, the Productivity group would welcome user views on the potential uses and usefulness of these data. Any feedback should be sent via email to Productivity@ons.gov.uk. These industry-by-region estimates have been released this quarter alongside experimental 2-digit labour productivity estimates and follow on from the publication of quarterly regional labour input metrics on 5 April 2017.
Back to table of contents