1. Methodology background
| National Statistic | |
| Survey name | Life Opportunities Survey (LOS) |
| Frequency | |
| How compiled | Sample based survey |
| Geographic coverage | Great Britain |
| Sample size | 19,950 |
| Last revised | 17 September 2013 |
2. Executive summary
The Life Opportunities Survey (LOS) is a large-scale longitudinal survey of disability in Great Britain and it is the first major national social survey that explores disability in terms of the barriers to participation that people experience.
The survey is wholly funded by the Department for Work and Pensions (DWP) and is carried out by the Office for National Statistics (ONS). Each wave of the survey spans 2 years: Wave One of the LOS took place between June 2009 and March 2011; Wave Two began in June 2010 and finished in March 2012 and Wave Three began in October 2012 and finished in September 2014.
The LOS uses the social model of disability, in which disability is viewed as the disadvantage, or restriction of activity and participation, caused by aspects of society that take little or no account of the needs of people with impairment. Therefore, the LOS assesses the level of participation of people with impairment and the barriers to participation that they face.
The LOS collects self-reported data on impairment, which is dependent upon the respondent’s perception of the limitations and severity of the impairment as well as collecting information on their ability to participate in different areas of life and the barriers they experience that prevent them participating in these areas of life.
LOS is a longitudinal survey and follows all respondents interviewed at Wave One at subsequent waves. The method of follow-up, beyond Wave One, is dependent on the respondent’s impairment status. All respondents who reported at least one impairment at Wave One are followed-up with a face-to-face interview in subsequent waves. Of the respondents who did not report any impairment at Wave One, a proportion of these have been selected to form a comparison group and are followed up with face-to-face interviews each wave. The remainder of respondents are followed up by telephone “screening” interviews and only those respondents who report an impairment are then followed up with face-to-face interviews at that wave.
The LOS data are cleaned, edited and weighted and a longitudinal dataset produced, see the Wave Two interim technical report for more details. The longitudinal weights are provided to enable longitudinal estimates such as rate of onset (into impairment) and rate of offset (from impairment) to be produced. Cross-sectional weights are provided to enable prevalence estimates for the population at each wave of the LOS to be produced.
The full Wave One report was published by DWP in December 2011. The Wave Two Report Part 1 and Part 2 results covering longitudinal analyses detailing changes between Wave One and Wave Two, was published in April 2014 and Wave Three in September 2015.The full Wave One dataset is available at the UK Data Archive.
This report contains the following sections:
- Output quality
- About the output
- How the output is created
- Validation and quality assurance
- Concepts and definitions
- Other information, relating to quality trade-offs and user needs
- Sources for further information or advice
3. Output quality
This report provides a range of information that describes the quality of the output and details any points that should be noted when using the output.
We have developed Guidelines for Measuring Statistical Quality; these are based upon the five European Statistical System (ESS) Quality Dimensions. This report addresses these quality dimensions and other important quality characteristics, which are:
- relevance
- timeliness and punctuality
- coherence and comparability
- accuracy
- output quality trade-offs
- assessment of user needs and perceptions
- accessibility and clarity
More information is provided about these quality dimensions in the following sections.
Back to table of contents4. About the output
Relevance
(The degree to which the statistical outputs meet users’ needs.)
The LOS collects information about all impairments that respondents may have. A suite of questions is also asked of respondents in order to classify whether they are disabled as defined by the Equality Act.
Respondents are asked questions about social care, employment, experiences of discrimination and crime and the financial situation of the household. They are also asked about their participation and whether they face any barriers in participation in the following eight life areas:
- education and training
- work
- economic life (the household’s ability to make ends meet)
- transport
- leisure activities
- accessibility in the home
- accessibility outside the home
- social contact
The LOS is wholly funded by the Department for Work and Pensions (DWP), which is also the main user of the survey data. The longitudinal data from the LOS are used to inform a new understanding of the dynamic nature of the disabled population and of the barriers faced by people with impairment. Understanding the dynamic nature of disability enables policy development to be more informed, in particular, of the support people need during onset of impairment.
As well as looking at barriers, future waves of LOS will also collect information about the main enablers to removing barriers. This will inform the work undertaken by government and its partners in business, the voluntary sector and wider civil society, to enable disabled people to live independently, have greater opportunities to work and be more active members of society.
The LOS Wave Three questionnaire included questions designed to collect information about onset and offset of impairment. In particular, additional questions were asked to provide understanding of any enablers that may have resulted in the removal of barriers to participation in particular life areas. The primary purpose of collecting information on enablers is for use in policy development by DWP.
In addition the information will allow further understanding of survey error, in particular the extent of mis-reporting of changes in experience of participation restriction.
Life Opportunities Survey data may also be used by other government departments for planning, policy and monitoring. Other users of the LOS include charity organisations and academics with an interest in disability-related issues. For example, LOS data can be used to investigate the relationship between disability and various socio-demographic factors, including age, sex, education and socio-economic status. More importantly, the longitudinal nature of the LOS data allows changes in these factors to be observed, in relation to changes to one’s impairment or disability status.
Timeliness and punctuality
(Timeliness refers to the lapse of time between publication and the period to which the data refer. Punctuality refers to the gap between planned and actual publication dates.)
The collection of Wave Two data was completed in March 2012. Interim results for Wave Two were published in April 2012, followed by the first part of the more detailed Wave Two report in November 2012. The time lag between the end of data collection and first publication of results from the wave is due to the time required for data processing, the creation of derived variables, merging the two waves of data to produce a longitudinal dataset and the calculation of weights. A number of quality assurance processes are also carried out to ensure that the dataset has been produced to a high standard in terms of accuracy. These processes are outlined in the How the output is created section.
For more details on related releases, the GOV.UK release calendar provides 12 months’ advance notice of release dates. If there are any changes to the pre- announced release schedule, public attention will be drawn to the change and the reasons for the change will be explained fully at the same time, as set out in the Code of Practice for Official Statistics.
Back to table of contents5. How the output is created
Sampling
The LOS uses a household sample, drawn from the small users Postcode Address File (PAF). A small user is defined as an address that receives an average of fewer than 50 items of mail per day.
At Wave One, the LOS employed a single-stage (unclustered) sample of addresses. The Wave One sample was issued over 2 years. The sample was allocated to interviewers to ensure geographic representation across each year of fieldwork.
When a sample is unclustered, addresses are spread out across postcode sectors, rather than a subset. An un-clustered sample helps to produce more precise results without increasing the sample size. This is because people with the same characteristics are often geographically clustered. Therefore, by increasing the “spread” of addresses sampled, this clustering effect is reduced. The un-clustered sample design has allowed the LOS to reduce its sample size by 10% whilst maintaining the same precision in survey estimates.
A total of 37,500 households were sampled for the LOS Wave One survey. Of these, around 33,900 households were eligible. The total of participating households was around 19,950, approximately 59% of the total eligible households at Wave One. Addresses containing no private households were classified as ineligible and excluded. The most common types of excluded addresses were non-residential or vacant addresses and addresses that contained only communal establishments such as hostels, hotels and boarding houses.
At Wave Two, only households containing an individual who reported an impairment at Wave One, households containing an individual selected for the “control” group and households containing an individual identified as having acquired an impairment during the “screening” telephone interview, were followed up with a face-to-face interview. The set sample for Wave Two was around 14,100 households, of these, 13,400 were eligible households. The total number of participating households was 9,700, approximately 73% of the total eligible households at Wave Two. More details about the LOS sample are provided in the Wave Two interim technical report.
Production processes
Once the data have been collected in the field, the process of creating, checking and editing the dataset commences. Each wave of data are processed separately and a flowchart of the procedures applied is shown in the following figure:
Figure 1: LOS data file

Source: Office for National Statistics
Download this image Figure 1: LOS data file
.png (23.7 kB)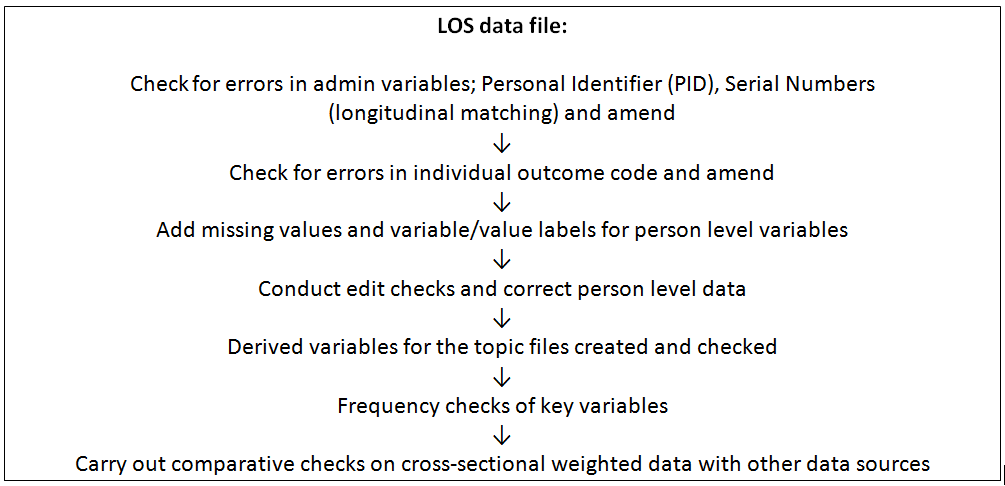
Once the dataset from each wave has been produced, a longitudinal dataset, containing data from more than one wave of data can be created. This is done by merging the datasets using a personal identification number, which was assigned to each respondent when he or she entered the survey. Prior to this merging process, checks were carried out to ensure each respondent was assigned a unique personal identification number and that this has carried through between successive waves. The accuracy of the matching was also verified by checking that names and date of birth matched between waves for each respondent, and that demographic characteristics such as age and sex for each respondent are consistent across waves.
Weighting
Survey data are routinely weighted to compensate for the different probabilities of individual households and people being included in the analysis data and to help reduce the random variation in survey estimates. Weighting the data also means that the results derived from the sample selected are representative of the population from which they were drawn.
The Wave One LOS data were weighted using a three-step approach. In the first step, the data were weighted to account for the chance of a household being selected. The second step weighted the data to compensate for non-response. Finally, the third step calibrated the data so that it matched the population totals in terms of individuals’ region, age group and sex.
Longitudinal weights are used for the longitudinal population (those respondents who are present at Waves One and Two) and are representative of the population at the time of Wave One. Analyses carried out for the LOS Wave Two Report Part 1 focused on changes for respondents from Wave One to Wave Two and therefore only utilised longitudinal weights.
The longitudinal weights incorporate adjustments for non-response and differential probabilities of selection at Wave One. The weights also adjust for loss to follow-up (LTFU) at Wave Two. LTFU occurs through two circumstances. One source of LTFU is where eligible people from Wave One cannot be traced for their Wave Two interview and, therefore, their eligibility status for the Wave Two interview is unknown. A second source of LTFU consists of people who became ineligible at Wave Two. Typically, this group predominantly comprises of those people who have left the cross- sectional population through death, migration or institutionalisation.
To create the longitudinal weight for each respondent, the Wave One weight was brought forward to use as the basis of the Wave Two base weight. The weight is then adjusted for LTFU to produce the longitudinal weight.
Statistical disclosure control
Statistical disclosure control methodology is also applied to LOS outputs. This ensures that information attributable to an individual is not disclosed in any publication. The Code of Practice for Official Statistics sets out principles for protecting data from being disclosed. By implementing statistical disclosure control, detail and information may be lost because some cells in published tables are required to be suppressed. However, this is done in order to avoid potential disclosure risk and to safeguard respondent confidentiality.
Back to table of contents6. Validation and quality assurance
Accuracy
(The degree of closeness between an estimate and the true value.)
Response rates
The voluntary nature of the LOS means that the survey results are subject to attrition - the sample size decreasing from wave to wave because respondents no longer wish to take part. The weighting procedure previously described takes into account this loss to follow-up. Response rates on a household level were previously detailed and further information, including response rates on the individual level and by LOS sub-sample groups (respondents with impairment, respondents in the control group and in the screening group) are found in the Wave One Technical Report, and the Wave Two Interim Technical Report.
Main threats to accuracy
Survey results are subject to various sources of error. The total error in a survey estimate is the difference between the estimate derived from the sample data collected and the true value for the population. The total error is made up of systematic (non-sampling) error and random (sampling) error.
Non-sampling error
Non-sampling error generally arises from errors in the collection, measurement and processing of the data. To minimise non-sampling error, the LOS questionnaire was administered using computer-assisted interviewing (CAI). CAI ensures that the questionnaire routing is followed correctly during the interview and inconsistencies and potential collection errors are able to be queried and where appropriate, corrected during the interview. Again, to minimise non-sampling error, as a result of errors arising from data collection, all ONS interviewers received both generic interviewer training and specific LOS training prior to working on the LOS. The LOS Wave One Technical Report provides further information about the data collection and processing of the data.
Sampling error
This relates to the fact that the sample chosen is only one of a large number of samples that could have been chosen. It follows then that any estimate derived from the sample is only one of a large number of estimates that could have been made. For users of survey data, the precision of the estimate is of interest, that is, how much the estimate would vary when different samples are drawn. For example, if a certain section of the population is excluded from the sample, estimates may be biased because the non-sampled population may have different characteristics to the sample population. The LOS attempts to compensate for this by weighting the data to adjust for different probabilities of selection and non-response across different sub-groups of the population and to correct for differential attrition across different sub-groups between Wave One and Wave Two.
Comparability and coherence
(Comparability is the degree to which data can be compared over time and domain, for example, geographic level. Coherence is the degree to which data that are derived from different sources or methods, but refer to the same topic, are similar.)
Cross-sectional data
In the final stages of validating the LOS cross-sectional Wave One data, comparative checks were undertaken to ensure that the survey estimates were broadly consistent with data from other sources. The following guidelines were followed when undertaking the external source validation process:
- identify alternative sources of comparable data
- produce frequencies and cross-tabulations to compare proportions in the LOS dataset with those from external sources
- if differences were found, ensure that reference periods, populations, geography, samples, modes of collection, questions, concepts and derivations were comparable
Many of the questions on the LOS have not been asked before and therefore no sources are available for comparison. Where data were available, the external validation process indicated that estimates from LOS were broadly consistent with estimates from other survey sources. In some instances, differences are expected given the specific survey context and differences in survey methodology.
Disability Discrimination Act (DDA) estimates from LOS have been compared against the 2008 to 2009 Family Resources Survey (FRS) to ensure that DDA prevalence is similar across a variety of economic and social characteristics. Other LOS modules have been validated against external sources. For example, impairment questions have been validated against the Northern Ireland Survey of Activity Limitation and Disability (NISALD) 2007 and economic life against the General Lifestyle Survey (GLF) 2008 to 2009.
Longitudinal data
Data from the first two waves of the LOS can be compared to monitor any changes that occur between waves. However, the value of such comparisons on the LOS may be limited for two reasons.
First, both results from the LOS and other research have demonstrated the transient nature of disability, which means that changes in responses between waves are expected. Second, the majority of the LOS questions are opinion-based and therefore responses might differ between waves. As described in the Relevance section, Wave Three of the LOS includes questions which investigate the source of change in responses from wave to wave, on topics relating to impairments and barriers to participation.
Back to table of contents7. Concepts and definitions
(Concepts and definitions describe the legislation governing the output and a description of the classifications used in the output.)
The LOS collects self-reported data on impairment, this is dependent upon the respondent’s perception of the limitations and severity of the impairment. According to LOS definitions, an adult is defined as having an impairment if they indicated that:
- they experience either moderate, severe or complete difficulty within at least one area of physical or mental functioning
- certain activities are limited in any way as a result; “activities” refer to different areas of physical or mental functioning, such as walking, climbing stairs or reading a newspaper
The LOS asks respondents to self-classify their impairment according to a list of 14 impairment types: sight, hearing, speaking, mobility, dexterity, long-term pain, chronic condition, breathing, learning, intellectual, behavioural, memory, mental and “other”. Respondents who reported a particular impairment are then asked the level and frequency of the limitation caused by the impairment. Questions about long-term health conditions are also included.
This method of classifying impairment status is compatible with the International Classification of Functioning, Disability and Health (ICF) developed by the World Health Organisation (WHO).
Other main definitions and concepts used on the LOS are included in the Glossary section of the Wave Two Report Part 1.
Back to table of contents8. Other information
Output quality trade-offs
(Trade-offs are the extent to which different dimensions of quality are balanced against each other.)
Timeliness of the LOS data is of particular importance when evidence is required for policy development. To address this, publication of the Wave Two results was in two parts: Part 1 was released in November 2012 and Part 2 in October 2013.
Part 1 was released within 7 months of the end of data collection to provide early access to the main results that fed into the evidence base for the Fulfilling Potential strategy being developed by the Department for Work and Pensions (DWP). To facilitate this early release of data the results were limited to analysis of longitudinal data only, for those respondents who reported an impairment at Wave One and/or Wave Two. By restricting the scope of the analysis, the processing and quality assurance required for the smaller dataset could be completed in a limited time period.
Part 2 of the report included analysis of all Wave One and Wave Two respondents and further longitudinal analysis as well as cross-sectional results.
Assessment of user needs and perceptions
(The processes for finding out about uses and users and their views on the statistical products.)
The LOS was developed with input from a reference group of disabled people (the LOS Reference Group), and an expert advisory group (EAG) consisting of academics and researchers in disability issues and longitudinal survey research. The LOS Reference Group comprised 60 members chosen to represent a wide variety of disabilities. This group played an important role in the development of the survey and continue to be consulted on the ongoing development. Consultation with the EAG has been carried out regularly to assess the approaches taken in analyses, and questionnaire development. Regular discussions with DWP are also carried out in regards to these issues.
To establish a more comprehensive picture of LOS user needs and perceptions of the survey, it is intended to establish a LOS User Group in future. DWP is considering the format, membership and function of this group and it is expected that a decision to form a formal user group will be made in the near future.
The Executive Summary for the LOS reports are also available in Easy Read, Braille and Audio to increase user accessibility.
Back to table of contents9. Sources for further information or advice
Accessibility and clarity
(Accessibility is the ease with which users are able to access the data, also reflecting the format in which the data are available and the availability of supporting information. Clarity refers to the quality and sufficiency of the release details, illustrations and accompanying advice.)
Our recommended format for accessible content is a combination of HTML webpages for narrative, charts and graphs, with data being provided in usable formats such as CSV and Excel. Our website also offers users the option to download the narrative in PDF format. In some instances other software may be used, or may be available on request. Available formats for content published on our website but not produced by us, or referenced on our website but stored elsewhere, may vary. For further information please refer to the contact details at the beginning of this report.
For information regarding conditions of access to data, please refer to the following links:
- Terms and conditions (for data on the website)
- Copyright and reuse of published data
- Pre-release access (ended from 1 July 2017)
- Accessibility