
Table of contents
- Key findings
- Summary
- Key mortality trends
- Deaths by underlying cause
- Leading causes of mortality in 2011
- Comparing leading causes of death in 2001 and 2011
- Impact of registration delays on mortality statistics, 2011
- Users and uses of mortality statistics
- Further information
- References
- Background notes
1. Key findings
- There were 484,367 deaths registered in England and Wales in 2011, a fall of 1.8 per cent compared with 2010
- Age-standardised mortality rates (ASMRs) in 2011 were the lowest ever recorded for England and Wales, at 6,236 deaths per million population for males and 4,458 deaths per million population for females
- Cancers were the ICD-10 chapter which had the largest percentage of deaths in 2011, accounting for 30 per cent of all deaths
- Among males and females the highest ASMR by ICD-10 chapter was for cancer with 2,023 deaths per million population for males and 1,478 deaths per million population for females
2. Summary
This bulletin presents the number of deaths registered in England and Wales in 2011 by age, sex and selected underlying cause of death. In addition, the ten leading causes of death have been ranked to provide a summary for both males and females. This bulletin provides more detailed statistics than the Death registration summary tables, England and Wales released in October 2012.
Mortality rates for 2011 have been calculated using mid-2011 population estimates based on the 2011 Census. Mortality rates for 2002-2010 have been calculated using mid-year estimates based on the 2001 Census. Population estimates for mid-2002 to mid-2010 will be revised to take account of the 2011 Census to ensure a consistent time series over the decade.
These revised population estimates for England and Wales are due to be published in December 2012/January 2013 while subnational estimates are due to be published in March/April 2013. Any comparisons of rates between 2002–2010 and 2011 should be treated with caution due to these planned revisions. To enable comparisons over time, mortality rates in 2011 have been compared to those in 2001 since rates for 2001 will not be revised.
Back to table of contents3. Key mortality trends
There were 484,367 deaths registered in England and Wales in 2011 compared with 493,242 in 2010, a fall of 1.8 per cent. The total number of deaths in 2011 comprised 234,660 male and 249,707 female deaths representing a fall of 1.4 per cent for males and 2.2 per cent for females compared with 2010. This is the third consecutive year that annual death registrations have been below half a million.
Figure 1: Age-standardised mortality rates (ASMRs), 1941-2011
England and Wales
Source: Office for National Statistics
Notes:
- Based on deaths registered in the calendar year.
- The ASMRs for 2002-2010 are calculated using the mid-year population estimates for the reference year based on the 2001 Census. Revised population estimates for 2002-2010 will be published in December 2012/January 2013. ASMRs for 2002-2010 will subsequently require revisions.
- The ASMRs for 2011 are calculated using the mid-2011 population estimates based on the 2011 Census.
- These rates are for all ages and are standardised to the European standard population, expressed per million population.
- ASMRs for 2002-2010 are due to be revised to take account of the 2011 Census
Download this chart Figure 1: Age-standardised mortality rates (ASMRs), 1941-2011
Image .csv .xlsThe age-standardised mortality rates (ASMR) in 2011 were the lowest since records began in England and Wales with 6,236 deaths per million population for males and 4,458 deaths per million for females. These age-standardised rates are for all causes and cover all ages (see Background note 5). Between 2001 and 2011, the age-standardised rate for males fell by 24 per cent (from 8,230 deaths per million), while for females it decreased by 20 per cent (from 5,566 deaths per million).
Over the course of the 20th century, ASMRs steadily decreased (figure 1). Up until the early 1970s, year-on-year fluctuations were higher, a likely consequence of influenza epidemics and cold winters although the relationship between temperature, influenza and winter mortality is complex (for further information see Excess winter mortality in England and Wales, 2010/11 provisional and 2009/10 final).
Mortality rates are generally falling; reasons for this include medical advances in the treatment of many illnesses and diseases. This is illustrated by the reduction in ASMRs for many causes of death (see table 9 (1.12 Mb Excel sheet)).
Back to table of contents4. Deaths by underlying cause
In January 2011, the software used for cause of death coding was updated from the International Classification of Diseases, Tenth Revision (ICD-10) v2001.2 to v2010. The main changes in ICD-10 v2010 are amendments to the modification tables and selection rules, which are used to ascertain a causal sequence and consistently assign underlying cause of death from the conditions recorded on the death certificate.
Overall, the impact of these changes is small although some cause groups are affected more than others. For further information, see the results of the bridge coding study on the ONS website. There is also another study looking at the impact on stillbirths and neonatal deaths.
Cancers (neoplasms), circulatory diseases and respiratory diseases were the broad disease groups (chapters) of the ICD-10 with the largest numbers of deaths in 2011. Cancers accounted for 30 per cent of all deaths, while circulatory diseases (which include deaths from ischaemic heart disease and strokes) and respiratory diseases (including deaths from pneumonia) accounted for 29 per cent and 14 per cent of all deaths respectively.
Over the course of the 20th century, there have been fairly steady decreases in mortality rates for these three broad disease groups in England and Wales. The reasons for this include improvements in the treatment of these illnesses.
Government backed initiatives to improve people’s health through better diet and lifestyle, for example, the Department of Health’s White Paper entitled 'Choosing Health: making healthy choices easier' published in 2004 could also have contributed to improvements in mortality rates.
Figure 2: Male age-standardised mortality rates, for three categories of cause of death, 2001 and 2011
England and Wales
Source: Office for National Statistics
Notes:
- The ASMRs for 2001 are calculated using the mid-2001 population estimates based on the 2001 Census.
- The ASMRs for 2011 are calculated using the mid-2011 population estimates based on the 2011 Census.
- These rates are for all ages and are standardised to the European standard population, expressed per million population; they allow comparisons between populations with different age structures, including between males and females and over time.
- These categories correspond to the three chapters of ICD–10 with the largest number of deaths in England and Wales.
Download this chart Figure 2: Male age-standardised mortality rates, for three categories of cause of death, 2001 and 2011
Image .csv .xls
Figure 3: Female age-standardised mortality rates, for three categories of cause of death, 2001 and 2011
England and Wales
Source: Office for National Statistics
Notes:
- The ASMRs for 2001 are calculated using the mid-2001 population estimates based on the 2001 Census.
- The ASMRs for 2011 are calculated using the mid-2011 population estimates based on the 2011 Census.
- These rates are for all ages and are standardised to the European standard population, expressed per million population; they allow comparisons between populations with different age structures, including between males and females and over time.
- These categories correspond to the three chapters of ICD–10 with the largest number of deaths in England and Wales.
Download this chart Figure 3: Female age-standardised mortality rates, for three categories of cause of death, 2001 and 2011
Image .csv .xlsThroughout the period 2001 to 2011, circulatory diseases (which include heart disease and strokes) have seen the largest fall in age-standardised rates for males and females (44 per cent). The fall in age-standardised mortality rates for cancer has been more gradual, with death rates 14 per cent lower for males and 10 per cent lower for females in 2011 than in 2001 (figures 2 and 3). In 2011 deaths from cancer have the highest age-standardised mortality rates for both males and females whereas in 2001 the highest rates were for circulatory diseases.
In ‘Improving Outcomes: A Strategy for Cancer’ (2011) the Department of Health states that although improvements have been made in the quality of cancer services in England, a significant gap remains in mortality rates compared with the European average.
The Outcomes Strategy sets out how the Department of Health aims to improve outcomes for all cancer patients and improve cancer survival rates, with the aim of saving an additional 5,000 lives every year by 2014/15. The Welsh Government’s Together for Health, Cancer Delivery Plan for the NHS up to 2016 sets out the vision for the population of Wales and what this means for NHS cancer services.
The male mortality rate for respiratory diseases decreased by 18 per cent between 2001 and 2011, while the rate for females fell by 12 per cent. Respiratory disease mortality rates in a given year are strongly influenced by the seasonal pattern of mortality in that year.
Back to table of contents5. Leading causes of mortality in 2011
The two tables below show the ten leading underlying causes of death in 2011 for males and females. These are ranked according to a World Health Organisation (WHO) list which categorises causes using ICD–10 groups specifically designed for determining the leading causes of death. The list has been modified for use in England and Wales (Griffiths et al., 2005 (145.6 Kb Pdf)). The leading causes of mortality are ranked according to the number of deaths registered for each group in 2011.
Leading causes of mortality for males, 2011
| England and Wales | ||||
| Rank | Underlying cause of death | Number of deaths | Percentage of all male deaths | Age-standardised mortality rate per million population |
| 1 | Ischaemic heart diseases (I20-I25) | 37,723 | 16.1 | 992 |
| 2 | Malignant neoplasm of trachea, bronchus and lung (C33, C34) | 16,881 | 7.2 | 457 |
| 3 | Cerebrovascular diseases (I60-I69) | 14,335 | 6.1 | 357 |
| 4 | Chronic lower respiratory diseases (J40-J47) | 13,539 | 5.8 | 340 |
| 5 | Dementia and Alzheimer's disease (F01, F03, G30) | 11,995 | 5.1 | 279 |
| 6 | Influenza and Pneumonia (J09-J18) | 11,072 | 4.7 | 273 |
| 7 | Malignant neoplasm of prostate (C61) | 9,671 | 4.1 | 238 |
| 8 | Malignant neoplasm of colon, sigmoid, rectum and anus (C18-C21) | 7,578 | 3.2 | 203 |
| 9 | Malignant neoplasms of lymphoid, haematopoietic and related tissue (C81-C96) | 6,066 | 2.6 | 163 |
| 10 | Diseases of the liver (K70-K77) | 4,787 | 2.0 | 157 |
| All male deaths | 234,660 | |||
| Source: Office for National Statistics Notes: 1. The cause of death groups used here are based on a list developed by the WHO, modified for use in England and Wales (Griffiths et al 2005). 2. The ASMRs for 2011 are calculated using the mid-2011 population estimates based on the 2011 Census. 3. These rates are for all ages and are standardised to the European standard population, expressed per million population. | ||||
Download this table Leading causes of mortality for males, 2011
.xls (26.1 kB)The leading cause of death for both sexes was ischaemic heart diseases, which accounted for 16.1 per cent of male deaths and 10.7 per cent of female deaths during 2011. The second leading cause of death was malignant neoplasm of trachea, bronchus and lung (lung cancer) for males and dementia and Alzheimer’s disease for females, replacing cerebrovascular diseases as the second leading cause of death for both males and females, compared with 2010.
If causes were ranked by their age-standardised mortality rates instead of number of deaths, the rankings for females would change. For example, influenza and pneumonia among females is ranked fourth on number of deaths but would be ranked seventh on mortality rates. This is because the age standardisation process gives less weight to deaths at older ages (where most of the influenza and pneumonia deaths occur).
For both sexes, lung cancer (malignant neoplasm of trachea, bronchus and lung) was the most common cancer, appearing second in the leading cause of death list for males and fifth for females. The lists also contain three other cancers for both males and females, including ones which are sex-specific (prostate cancer and female breast cancer).
Leading causes of mortality for females, 2011
| England and Wales | ||||
| Rank | Underlying cause of death | Number of deaths | Percentage of all female deaths | Age-standardised mortality rate per million population |
| 1 | Ischaemic heart diseases (I20-I25) | 26,712 | 10.7 | 434 |
| 2 | Dementia and Alzheimer's disease (F01, F03, G30) | 25,767 | 10.3 | 338 |
| 3 | Cerebrovascular diseases (I60-I69) | 21,642 | 8.7 | 331 |
| 4 | Influenza and Pneumonia (J09-J18) | 15,079 | 6.0 | 217 |
| 5 | Malignant neoplasm of trachea, bronchus and lung (C33, C34) | 13,267 | 5.3 | 298 |
| 6 | Chronic lower respiratory diseases (J40-J47) | 13,209 | 5.3 | 241 |
| 7 | Malignant neoplasms of female breast (C50) | 10,328 | 4.1 | 244 |
| 8 | Malignant neoplasm of colon, sigmoid, rectum and anus (C18-C21) | 6,428 | 2.6 | 127 |
| 9 | Diseases of the urinary system (N00-N39) | 5,429 | 2.2 | 80 |
| 10 | Malignant neoplasms of lymphoid, haematopoietic and related tissue (C81-C96) | 4,993 | 2.0 | 104 |
| All female deaths | 249,707 | |||
| Source: Office for National Statistics Notes: 1. The cause of death groups used here are based on a list developed by the WHO, modified for use in England and Wales (Griffiths et al 2005). 2. The ASMRs for 2011 are calculated using the mid-2011 population estimates based on the 2011 Census. 3. These rates are for all ages and are standardised to the European standard population, expressed per million population. | ||||
Download this table Leading causes of mortality for females, 2011
.xls (26.1 kB)6. Comparing leading causes of death in 2001 and 2011
In 2001 deaths from ischaemic heart disease accounted for 23.1 per cent of all male deaths, this fell by 7 percentage points by 2011 when it accounted for 16.1 per cent of all male deaths. In contrast the percentage of deaths from dementia and Alzheimer’s disease rose by 6 percentage points in the same period.
In 2011, for females the percentage of deaths from ischaemic heart disease fell by 6.3 percentage points compared with 2001. In contrast the percentage of deaths from dementia and Alzheimer’s disease rose by 5.9 percentage points in the same period for females.
This change may partially be due to the update from ICD-10 version 2001.2 to ICD-10 version 2010 in 2011. The results of the bridge coding study showed that within the dementia cause group there is a large change for vascular dementia (F01), which is a result of a correction implemented in ICD-10 v2010. In ICD-10 v2001.2, vascular dementia deaths were coded as cerebrovascular disease (I60–I69), in particular I67.9 (cerebrovascular disease, unspecified).
Also, in ICD-10 v2001.2 a number of dementia deaths were coded as N39.0 (urinary tract infection, site not specified). This change is due to an addition to the modification tables of valid causal sequences.
Figure 4: Percentage of deaths for the ten leading causes of death for males, 2001 and 2011
England and Wales

Source: Office for National Statistics
Notes:
- The cause of death groups used here are based on a list developed by the WHO, modified for use in England and Wales (Griffiths et. al 2005).
- Figures for 2001 are given for the top ten causes of death in 2011 as a comparison.
Download this image Figure 4: Percentage of deaths for the ten leading causes of death for males, 2001 and 2011
.png (16.2 kB) .xls (27.6 kB)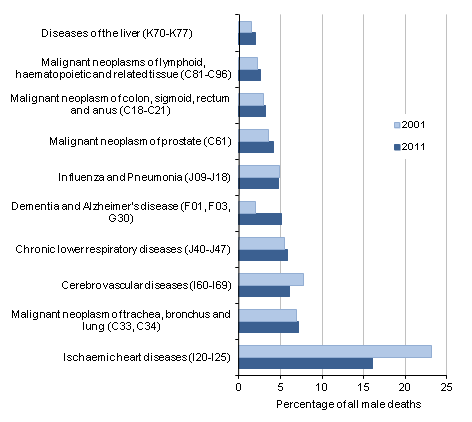
Figure 5: Percentage of deaths for the ten leading causes of death for females, 2001 and 2011
England and Wales

Source: Office for National Statistics
Notes:
- The cause of death groups used here are based on a list developed by the WHO, modified for use in England and Wales (Griffiths et. al 2005).
- Figures for 2001 are given for the top ten causes of death in 2011 as a comparison.
Download this image Figure 5: Percentage of deaths for the ten leading causes of death for females, 2001 and 2011
.png (16.9 kB) .xls (27.1 kB)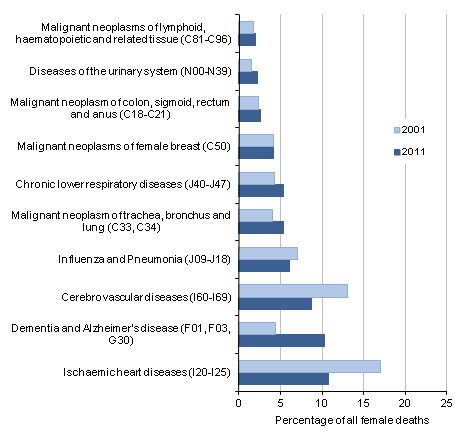
7. Impact of registration delays on mortality statistics, 2011
The information used to produce mortality statistics is based on the details collected when deaths are certified and registered. In England and Wales, deaths should be registered within five days of the death taking place but there are some situations which result in the registration of the death being delayed. Deaths considered unexpected, accidental or suspicious will be referred to a coroner who may order a post mortem and/or carry out a full inquest to ascertain the reasons for the death.
The death cannot be registered until the inquest is completed, which can take many months or even years, and ONS is not notified that a death has occurred until it is registered. If someone is to be charged in relation to the death, the coroner must adjourn the inquest, and they may carry out an accelerated registration. However, the full details are not recorded until the inquest is completed. These accelerated registrations are assigned a U50.9 code, and are included in the DR Series Table 5 (2.85 Mb Excel sheet).
Mortality statistics are presented based on the number of deaths registered in a particular period, rather than the number of deaths that actually occurred in that period. This approach is used as a trade off between timeliness and data quality to meet user needs.
In 2011 there were 484,367 deaths registered in England and Wales. Of these deaths, 463,450 occurred in 2011, representing 95.7 per cent of the deaths registered. The proportion of deaths registered in 2011 that also occurred in 2011 varies depending upon the underlying cause of death classified using the ICD-10. More information on registration delays is available on the ONS website.
Back to table of contents8. Users and uses of mortality statistics
The Office for National Statistics uses death data to:
Produce population estimates and population projections at both national and subnational level.
Quality assure Census estimates.
Report on social and demographic trends.
Carry out further analysis, for example life expectancies and causes of death (including deaths from injury and poisoning, certain infections and drug related deaths).
Further analyse infant mortality where infant deaths are linked to their corresponding birth record to enable more detailed analyses on characteristics such as age of parents, birthweight and whether the child was born as part of a multiple birth.
The Department of Health (DH) is a key user of mortality statistics. The Public Health Outcomes Framework sets out the desired outcomes for public health and how these will be measured. Data are used, for example, to inform policy decisions and to reduce premature mortality from the major causes of death under an NHS Outcomes Framework.
The outcomes framework has replaced the Public Service Agreement system that was in place under the previous government. Infant mortality is also seen as a key measure among health outcomes and there is a long established link between social and health inequalities, and infant mortality.
Infant mortality continues to take a central role in DH’s work on health inequalities. Other key users of mortality data are local authorities and other government departments for planning and resource allocation. The Department for Work and Pensions uses detailed mortality statistics to feed into statistical models they use for pensions and benefits.
Users also include other public sector organisations such as the Police and the Home Office who are interested in data on external causes of death. Private sector organisations such as banks, insurance and investment companies are particularly interested in deaths by single year of age and region which feeds into risk estimation, while funeral directors are interested in the number of deaths occurring at the local area level.
Other users include academics, demographers and health researchers who conduct research into trends. Lobby groups and charities use death statistics to support their cause, for example, campaigns against alcohol and drug misuse or suicide. Organisations such as Eurostat and the UN use death statistics for making international comparisons. The media also report on key trends in mortality.
Back to table of contents