
Table of contents
- Key points
- Overview
- User engagement
- R&D expenditure
- R&D expenditure by product group
- Civil and Defence R&D expenditure, by broad product group
- R&D expenditure by industry
- Employment in R&D performed in UK businesses
- Country and regional breakdown of R&D expenditure and employment
- Sources of funds for R&D performed UK businesses
- Ownership of businesses performing R&D in the UK
- International comparison
- Background notes
- Methodology
1. Key points
In 2012, total business Research and Development (R&D) expenditure in the UK, in current prices, decreased by 2% to £17.1 billion compared with 2011. In constant prices, R&D expenditure decreased by 4% compared with 2011
The largest decrease in expenditure in 2012 was in Pharmaceuticals which decreased by £727 million (15%), in current prices
Defence R&D expenditure decreased by 10% in 2012 to £1.6 billion. This is partly due to government contracts awarded to UK businesses for the development of aircraft, naval ships, submarines and their systems and equipment moving from the research to production stages
In 2012, expenditure on R&D in the UK by foreign owned businesses constituted 51% of total expenditure
Business R&D expenditure in 2012 represented 1.1% of Gross Domestic Product (GDP), a level it has been since 2007
2. Overview
This release provides estimates of businesses' expenditure and employment relating to R&D performed in the UK in 2012, irrespective of the residence of the ultimate owner or user of the R&D produced.
Two types of estimates are presented in this release, current and constant price terms. Estimates in current prices present the value of R&D expenditure collected from the Business Enterprise Research and Development (BERD) survey. Constant price estimates have been adjusted for inflation between years using the GDP deflator. This allows changes in the volume of R&D expenditures to be examined on a comparable basis over time.
While R&D is often thought of as synonymous with ‘high-tech’ firms that are on the cutting edge of new technology, many established businesses that produce consumer goods and services spend large sums of money, on a systematic basis, improving existing products.
For the purposes of this release, R&D and related concepts follow internationally agreed standards defined by the Organisation for Economic Cooperation and Development (OECD), as published in the ‘Frascati’ Manual. In the Frascati Manual, R&D is defined as “creative work undertaken on a systematic basis in order to increase the stock of knowledge, including knowledge of man, culture and society and the use of this stock of knowledge to devise new applications”.
The Frascati Manual was originally written by, and for, the experts in OECD member countries that collect and issue national data on R&D. The definitions provided in this manual are internationally accepted and now serve as a common language for designing and evaluating science and technology policy.
The estimates in this release are derived from the BERD survey. The survey has been run annually since 1993. Each year approximately 5,000 UK businesses are selected for this survey from a continually updated register of known R&D performers. The main purpose of the BERD survey is to supply data for policy and monitoring purposes on science and technology, of which R&D is an important part.
The National Accounts provide the framework that is used to define and measure the UK’s economic performance, such as the value of the UK’s Gross Domestic Product (GDP). Changes to the European System of Accounts (ESA) mean that from 2014 onwards, expenditure on R&D will contribute to the formation of assets and therefore the value of the UK’s net worth.
In March 2014 ONS will publish UK Gross Domestic Expenditure on Research and Development (GERD) for the year 2012. The UK GERD statistical bulletin includes estimates for R&D carried out by the following four sectors of the economy, as defined in the Frascati manual, namely business enterprise (BERD), higher education (HERD), government including research councils (GovERD) and Private Non-Profit (PNP) organisations. GERD uniquely provides information on total R&D expenditure in the UK, and is the preferred measure for use in international comparisons of overall R&D expenditure.
Back to table of contents3. User engagement
We are constantly aiming to improve this release and its associated commentary. We would welcome any feedback you might have, and would be particularly interested in knowing how you make use of these data to inform your work. Please contact us via email: RandD@ons.gov.uk or telephone David Matthews on +44 (0)1633 456756.
Back to table of contents4. R&D expenditure
Since 1985 there has been a steady increase in R&D expenditure in current prices. In 2012, £17.1 billion was spent on R&D performed by UK businesses. This is compared with £11.5 billion in 2000 and £5.0 billion in 1985. The 2012 estimate of £17.1 billion is a decrease of 2% in current prices compared with the 2011 estimate (£17.5 billion).
In constant prices, the 2012 estimate of £17.1 billion is a 4% decrease on the 2011 estimate (£17.8 billion) of expenditure on R&D performed in UK businesses.
Despite business R&D expenditure decreasing between 2011 and 2012, there has been a trend of increasing expenditure since 1985. Over this period there has been an increase of £6.3 billion, in constant prices, on the 1985 estimate of £10.8 billion (Figure 1).
Figure 1: R&D expenditure by businesses in the UK
Source: Office for National Statistics
Download this chart Figure 1: R&D expenditure by businesses in the UK
Image .csv .xlsFigure 2 shows expenditure on business R&D as a percentage of GDP since 1985. Total business R&D expenditure in 2012 represented 1.1% of GDP. This estimate is in line with recent years and is a slight decrease on the 1.2% estimate for the years 1999 and 2001. Figure 2 highlights that business R&D expenditure as a percentage of GDP peaked in 1986 at 1.5%.
Figure 2: R&D Expenditure by businesses in the UK as a percentage of GDP
Current Prices
Source: Office for National Statistics
Download this chart Figure 2: R&D Expenditure by businesses in the UK as a percentage of GDP
Image .csv .xlsA target set by the UK government in the Science and Innovation Framework 2004 - 2014 was to increase business investment in R&D towards a goal of 1.7% of GDP by the end of 2014.
Back to table of contents5. R&D expenditure by product group
On an annual basis, the 400 largest R&D spenders are asked to select the industry product groups that best describe the type of R&D activities that they undertake. For the 2012 survey, the largest 400 spenders were those businesses previously reporting more than approximately £4.6 million expenditure on R&D. The concept of ‘product groups’ is discussed in detail as part of the background notes to this release (Background Note 9).
The UK is home to some of the world’s largest pharmaceutical companies. In 2012, Pharmaceuticals remained the largest product group with £4.2 billion expenditure, accounting for 25% of total expenditure on R&D performed in UK businesses. However, R&D expenditure in Pharmaceuticals decreased by 15% in current prices compared with the 2011 estimate of £4.9 billion (Figure 3).
The Telecommunications product group also showed a decrease in expenditure of 15% in current prices since 2011, from £1.1 billion to £889 million in 2012. This accounted for 5% of total expenditure in 2012. More starkly, since 2007, this product group has decreased by £843 million (49%) in constant prices.
The largest increase in expenditure since 2011 was in the Motor vehicles and parts product group, which increased by £207 million in current prices from the 2011 estimate to £1.7 billion in 2012, a 14% increase. The Motor vehicles and parts product group made up 10% of expenditure in 2012.
Other product groups reporting around £1 billion or more R&D expenditure in the UK in 2012 were:
computer programming and information service activities, £1.9 billion (11% of total R&D expenditure)
aerospace, £1.5 billion (9%)
machinery and equipment, £998 million (6%)
These six product groups accounted for 66% of the total UK business R&D expenditure in 2012.
Figure 3a: R&D expenditure (current prices) by businesses in the UK, by largest product groups
Source: Office for National Statistics
Download this chart Figure 3a: R&D expenditure (current prices) by businesses in the UK, by largest product groups
Image .csv .xls
Figure 3b: R&D expenditure (current prices) by businesses in the UK, by largest product groups
| £ million | ||||
| 2002 | 2007 | 2011 | 2012 | |
| Pharmaceuticals | 3,169 | 3,935 | 4,933 | 4,206 |
| Computer programming and information service activities | 866 | 1,498 | 1,847 | 1,930 |
| Motor vehicles and parts | 916 | 933 | 1,525 | 1,732 |
| Aerospace | 1,352 | 2,070 | 1,438 | 1,518 |
| Machinery and equipment | 780 | 1,033 | 973 | 998 |
| Telecommunications | 726 | 1,535 | 1,051 | 889 |
| Source: Office for National Statistics | ||||
Download this table Figure 3b: R&D expenditure (current prices) by businesses in the UK, by largest product groups
.xls (37.4 kB)Of the 33 R&D product groups, 20 saw an increase in levels of R&D expenditure by UK businesses in current prices, since 2011, while 13 product groups decreased. In terms of percentage growth, the largest increases were in the Construction (87%); Electricity, gas and water (83%); Textiles, clothing and leather products (43%) and Consumer electronics and communication equipment (33%) product groups.
Back to table of contents6. Civil and Defence R&D expenditure, by broad product group
R&D expenditure and employment can be split between the civil and defence sectors. Expenditure in the civil sector in 2012 (£15.5 billion) accounted for 91% of total business R&D expenditure.
In 2012, in current prices, civil R&D expenditure decreased by 1% from £15.7 billion to £15.5 billion and defence R&D decreased by 10% from £1.8 billion to £1.6 billion compared with 2011.
Figure 4 shows that while business R&D expenditure in the civil sector increased by 56% in constant prices since 1989, business expenditure on R&D in the defence sector decreased by 47% in constant prices over this period.
Figure 4: Expenditure on Civil and Defence R&D performed in UK businesses
Source: Office for National Statistics
Download this chart Figure 4: Expenditure on Civil and Defence R&D performed in UK businesses
Image .csv .xlsCivil R&D expenditure can be further split between the Manufacturing, Services and 'Other’ sectors (see Table SB5 in 2012 Datasets (1.13 Mb Excel sheet). In 2012, expenditure in Manufacturing accounted for 69% of total civil R&D expenditure, compared with 77% in 2001. Manufacturing accounted for 94% of total defence R&D expenditure in 2012, compared with 92% in 2001.
Mechanical engineering, part of the Manufacturing sector, was the largest contributor to defence R&D expenditure (33% of total defence expenditure) in 2012, with Aerospace (22%) and Electrical machinery (17%) second and third respectively.
Back to table of contents7. R&D expenditure by industry
Estimates of R&D expenditure on an industry basis, according to the Standard Industrial Classification (SIC), were first introduced in the 2011 BERD statistical bulletin to meet an expressed user need (See Table 27 in 2012 datasets (1.13 Mb Excel sheet) ).
The highest level of R&D expenditure in 2012 by SIC was performed by businesses that were classified to the ‘Scientific research and development’ industry, at £4.7 billion (27% of total expenditure) (Figure 5).
Five other industries had R&D expenditure of around £1 billion or more:
computer programming, consultancy and related activities, £1.6 billion (9% of total R&D expenditure)
manufacture of motor vehicles and trailers, £1.5 billion (9%)
manufacture of other transport equipment, £1.4 billion (8%)
architectural and engineering activities, £1.2 billion (7%)
manufacture of computer, electronic and optical products, £977 million (6%)
These six industries accounted for 66% of the total UK business R&D expenditure in 2012.
Figure 5a: R&D expenditure (current prices) by businesses in the UK, by largest industries
Source: Office for National Statistics
Download this chart Figure 5a: R&D expenditure (current prices) by businesses in the UK, by largest industries
Image .csv .xls
Figure 5b: R&D expenditure (current prices) by businesses in the UK, by largest industries
| £ million | |||
| 2010 | 2011 | 2012 | |
| Scientific research and development, | 5,510 | 5,867 | 4,688 |
| Computer programming, consultancy and related activities, | 1,109 | 1,522 | 1,564 |
| Manufacture of motor vehicles, trailers and semi-trailers | 1,039 | 1,296 | 1,478 |
| Manufacture of other transport equipment, | 1,158 | 1,198 | 1,408 |
| Architectural and engineering activities, | 748 | 883 | 1,155 |
| Manufacture of computer, electronic and optical products, | 835 | 965 | 977 |
| Source: Office for National Statistics | |||
Download this table Figure 5b: R&D expenditure (current prices) by businesses in the UK, by largest industries
.xls (37.4 kB)It is important to note that estimates of R&D by industry are not directly comparable with the estimates of R&D expenditure by product groups. This is because businesses may report significant R&D in product groups which are different to the main classification of their business according to the SIC. See Background Notes 9 and 10, which explain the concepts of product groups and SIC in more detail.
Back to table of contents8. Employment in R&D performed in UK businesses
Estimates of employment in R&D are produced on a full-time equivalent (FTE) basis, whereby businesses convert part-time employees’ hours into a full-time employees’ equivalent. FTE estimates provide a better indication of total labour input than a simple headcount.
Employment in R&D has remained relatively stable in recent years. The lowest level of employment in R&D in the last decade occurred in 2005, when 146,000 FTE were employed, while the highest level (160,000) was reached in 2011 (Figure 6).
The number of FTE staff employed in R&D remained unchanged at 160,000 between 2011 and 2012. The 2012 estimate comprised of:
90,000 scientists and engineers (56%)
43,000 technicians (27%)
27,000 administrative staff (17%)
Figure 6: Employment in R&D performed in UK businesses
Source: Office for National Statistics
Download this chart Figure 6: Employment in R&D performed in UK businesses
Image .csv .xls9. Country and regional breakdown of R&D expenditure and employment
It is possible, using data from the BERD survey, to analyse R&D expenditure by country and region. In this context, ‘region’ refers to the location where a business performs R&D, not the location of either the business’ headquarters or that of any external funders.
The South East and East of England continue to dominate where R&D expenditure takes place in the UK. These two regions combined accounted for 44% of UK business R&D expenditure in 2012 (Map 1). These regions combined also employed 66,000 FTE which made up 41% of total R&D employment in 2012. The regions with the lowest levels of employment in R&D were the North East and Wales, both employing 3,000 FTE R&D staff (Map 2).
Map 1: Expenditure on R&D performed in UK businesses, 2012

Download this image Map 1: Expenditure on R&D performed in UK businesses, 2012
.png (237.6 kB)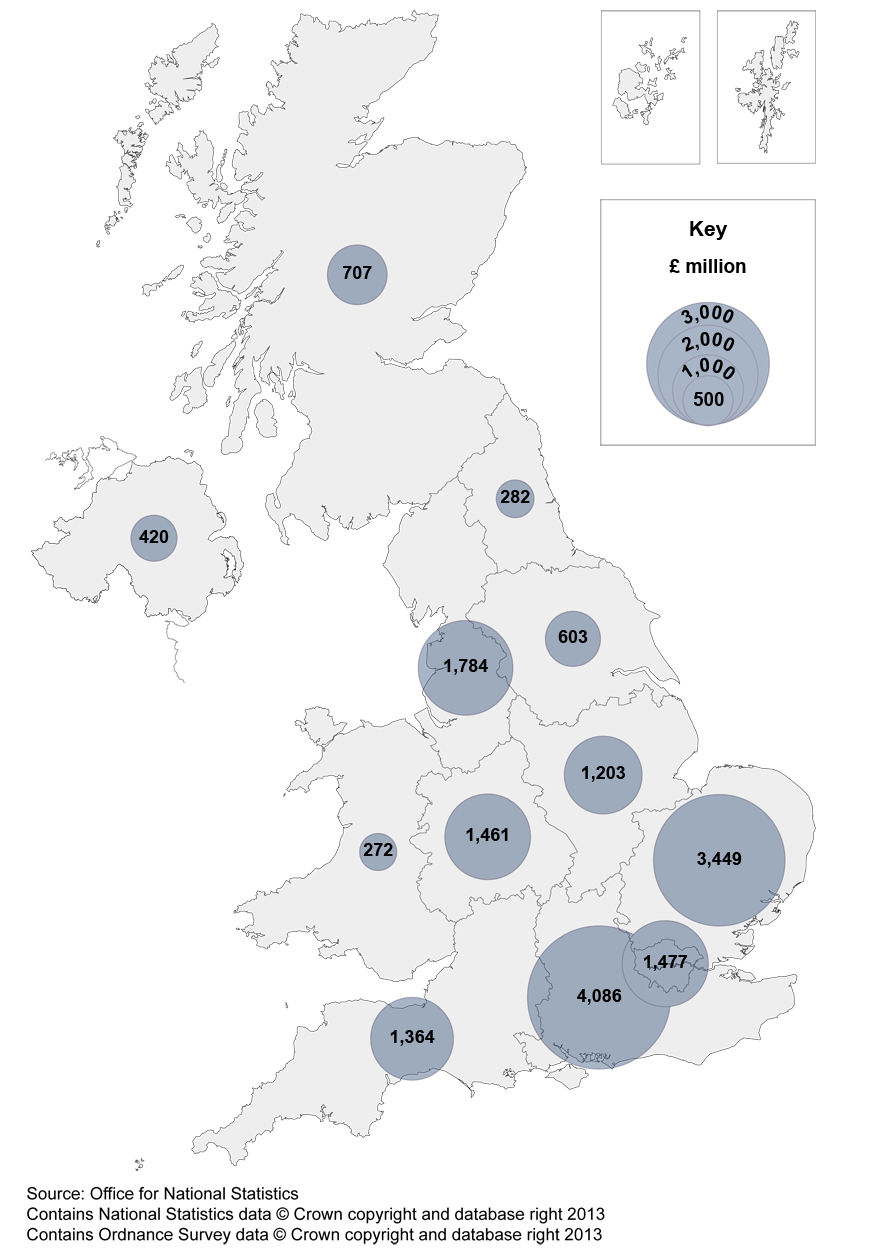
The majority (92%) of UK R&D expenditure was carried out in England in 2012.
While Northern Ireland, Wales and Scotland showed increases in current prices (19%, 6% and 4% respectively) in R&D expenditure in 2012 compared with 2011, there was a decrease in expenditure in England of 3%.
Map 2: Employment on R&D performed in UK businesses, 2012
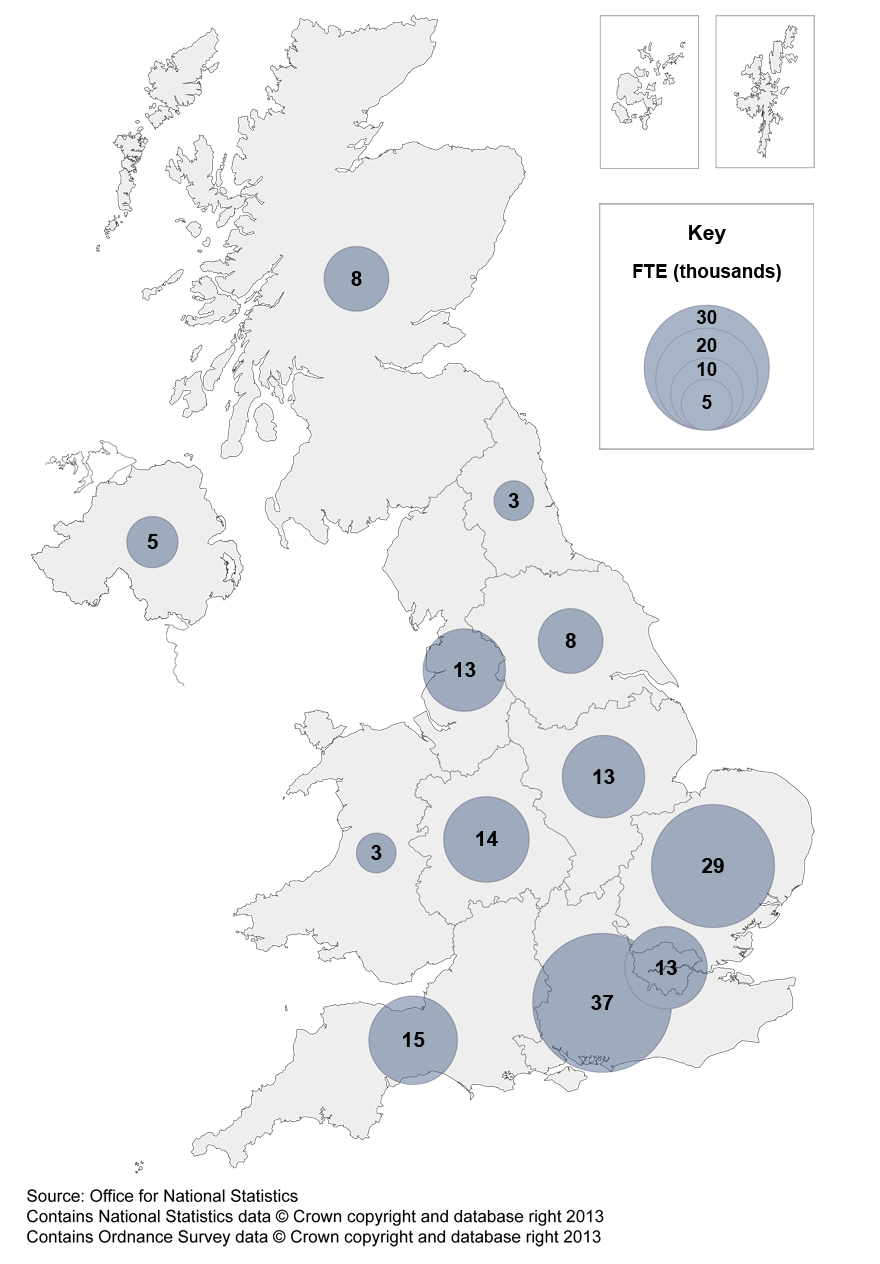
Download this image Map 2: Employment on R&D performed in UK businesses, 2012
.png (297.9 kB)
10. Sources of funds for R&D performed UK businesses
The largest source of R&D funding in 2012 was businesses’ own funds at £11.3 billion, which accounted for 66% of total R&D expenditure.
Overseas funding of UK businesses’ R&D was £4.0 billion in 2012, 24% of total business UK R&D expenditure (Figure 7).
Figure 7: Sources of funds for R&D performed in UK businesses
Source: Office for National Statistics
Download this chart Figure 7: Sources of funds for R&D performed in UK businesses
Image .csv .xlsThe UK Government’s funding of businesses’ R&D in 2012 was £1.3 billion, a decrease of £158 million (10%) in current prices. This represented 8% of total business R&D expenditure. UK government funding was predominantly in the defence sector (£1.1 billion), which made up 78% of government funding of business R&D expenditure. This includes government awarded contracts to UK businesses to develop aircraft, naval ships, submarines and their systems and equipment.
Back to table of contents11. Ownership of businesses performing R&D in the UK
In 1993, when the BERD survey began on an annual basis, 73% of UK business R&D expenditure was by UK owned businesses and 27% by foreign owned businesses. The majority of UK business R&D expenditure continued to be performed by UK owned businesses until 2010, when 59% of UK business R&D expenditure was performed by UK owned businesses. In 2011, for the first time, just over half (51%) of business R&D expenditure in the UK was by foreign owned businesses. This pattern of ownership continued in 2012 (**Figure 8**)
On 15 March 2013, ONS published R&D expenditure by foreign owned businesses, which contained more detailed analysis of the pattern of ownership of businesses that performed R&D between 1995 and 2011. This was based on the estimates that had been included in the 2011 BERD statistical bulletin. Estimates for 2010 and 2011 have been revised in this bulletin. It should be noted that the original 2011 estimate of the proportion of R&D expenditure by foreign owned businesses has been revised upwards from 50% to 51%.
Figure 8: Ownership of businesses who perform R&D in the UK
Source: Office for National Statistics
Download this chart Figure 8: Ownership of businesses who perform R&D in the UK
Image .csv .xls12. International comparison
When comparing total business R&D intensity across countries, it is important to take into account differences in their industrial structure. OECD produces a Science, Technology and Industry Scoreboard to facilitate these comparisons.
In March 2012, as part of a publication ‘The UK R&D Landscape’, it was reported that “the business enterprise component of R&D expenditure in the UK is low by international standards, even after adjusting for structural difference between countries. It is also concentrated in the hands of a few very large firms and the small number of industrial sectors in which they are based".
Back to table of contents