
Table of contents
- Foreword
- Key points
- Introduction
- Marital status overview
- Age and sex distribution by marital status
- Geographical variation of marital status
- Marital status comparisons within the United Kingdom
- European marital status comparisons
- Living arrangements for the household population
- United Kingdom comparison of living arrangements
- Background notes
1. Foreword
This story analyses 2011 Census data on marital status (legal partnership status including marriage and civil partnership) for adults (aged 16 and over) usually resident in England and Wales, noting key changes since 2001.
Living arrangements of those resident in households are also analysed as an alternative to legal partnership status, including those cohabiting who are not in a legal partnership (living arrangements for those living in communal establishments are not recorded). Analyses are summarised at national and local authority levels. Comparisons are made with Scotland, Northern Ireland and other developed countries.
Back to table of contents2. Key points
The proportions of single and married adults varied little between England, Wales, Scotland and Northern Ireland. Almost half (45 to 48 per cent) were married. The proportion of adults in civil partnerships was highest in England (0.2 per cent), double that of the lowest, Northern Ireland (0.1 per cent).
The single (never married) category showed the greatest increase in proportion: from 30 per cent (12.5 million) in 2001 to 35 per cent (15.7 million) in 2011 in England and Wales. More people aged 30 to 49 were single, rising from 24 per cent in 2001 to 31 per cent in 2011.
London had eight of the ten local authorities with the highest proportions of single people in the adult population in 2011; the highest was Islington (60 per cent). These high proportions reflect the younger age structure of London compared to other regions.
Widowed was the only marital status category to show declines in both number and proportion; from 3.5 million (8.4 per cent) in 2001 to 3.2 million (7.0 per cent) in 2011. This reflects increases in life expectancy.
More than half of adults living in households in England, Wales, Scotland and Northern Ireland were living as a couple in 2011, either married or cohabiting. Cohabitation levels were lowest in Northern Ireland (6.2 per cent) and highest in England (11.9 per cent).
3.7 per cent (785,000) of married people living in households were not living together as a married couple and did not identify themselves as separated. 82 per cent (640,000) of these were ‘living apart together’ (married or civil partnered, not separated and not living in a couple), an increase of 71 per cent, from 375,000 in 2001. The remaining 18 per cent (145,000) were cohabiting with another partner (and likely to be separated even though they had not stated this).
In 2011, 12 per cent (5.3 million) of adults living in households in England and Wales were living as part of a cohabiting couple; this was an increase from 9.8 per cent (4.0 million) in 2001. The age group that saw the largest increase in people cohabiting were those aged 40 to 49 (from 9.3 per cent in 2001 to 14 per cent in 2011).
3. Introduction
The 2011 Census identified both the legal partnership status1 for the usually resident2 adult population (aged 16 and over), and living arrangements for the adult household population. Marital and civil partnership status are legally defined but may not reflect living arrangements; for example single people (never married or in a civil partnership) may be cohabiting. Living arrangements reflect whether people in households were living with a partner regardless of their legal partnership status.
The adult population accounted for 45.5 million (81 per cent) of the total usually resident population in 2011, an increase from 41.5 million (80 per cent) in 2001 (table 1). This population consisted of persons in households3 and persons in communal establishments4.
Adults in households accounted for 98 per cent of the total usually resident adult population of England and Wales in both 2001 and 2011.
Table 1: Overview of usually resident population; England and Wales, 2001 and 2011
| 2001 Census (Thousands) | 2011 Census (Thousands) | Per cent change 2001-11 | |
| Usually resident population | 52,042 | 56,076 | 7.8 |
| Usually resident adult population (aged 16 and over) | 41,553 | 45,497 | 9.5 |
| Persons in households | 51,108 | 55,071 | 7.8 |
| Persons in households aged 16 and over | 40,667 | 44,533 | 9.5 |
| Persons in communal establishments | 934 | 1,005 | 7.5 |
| Persons in communal establishments aged 16 and over | 887 | 964 | 8.7 |
| Source: 2011 Census, Office for National Statistics | |||
| Note: | |||
| 1. Census 2011 table DC1104 and 2001 table S001 were used to produce table 1. | |||
Download this table Table 1: Overview of usually resident population; England and Wales, 2001 and 2011
.xls (56.8 kB)A previous report on families and households in England and Wales summarised marital status and living arrangements separately at the national level in 2011. This story continues the analysis at local level, addressing the interaction between the two measures and using data by age group to explain changes in the way people were living. Information on marital status and living arrangements is used by a variety of people, including:
The government for analysing future benefit uptake
Actuaries for providing advice on matters relating to pension schemes such as the proportion of people in legally recognised partnerships1 for occupational pension schemes
Those planning and delivering services. For example, information about people living in couples is used to help produce projections of the number of households
Researchers, academics and journalists for analysing societal changes in the way we are living.
Notes for introduction
Legal partnership status includes the following categories: single (never married or in a civil partnership), married, civil partnership, separated (still legally married or in a civil partnership), divorced or formerly in a civil partnership now dissolved, and widowed or surviving partner from a civil partnership.
The usually resident population refers to people who live in the UK for 12 months or more, including those who have been resident for less than 12 months but intend to stay for a total period of 12 months or more. The population base for the 2011 Census was the usually resident population of England and Wales, defined as anyone who, on the night of 27 March 2011, was either (a) resident in England and Wales and who had been resident, or intended to be resident in the UK for a period of 12 months or more, or (b) resident outside the UK but had a permanent England and Wales address and intended to be outside the UK for less than a year.
A household was defined in the 2011 Census as one person living alone, or a group of people (not necessarily related) living at the same address who share cooking facilities and share a living room, sitting room or dining area.
A communal establishment is an establishment providing managed residential accommodation. ‘Managed’ in this context means full-time or part-time supervision of the accommodation. Communal establishments include sheltered accommodation units, hotels, guest houses, B&Bs and inns and pubs, and all accommodation provided solely for students (during term-time). More information is available in the 2011 Census Definitions.
4. Marital status overview
An overview of changes in the marital status distribution of the adult1 usually resident population2 between 2001 and 2011 is available in a previous publication on families and households in England and Wales. Marital status is used to refer to legal partnership status. Categories are:
Single (never married or never in a civil partnership)
Married (including those in civil partnerships)
Separated (but still legally married or in a civil partnership)
Divorced (including formerly in a civil partnership which is now legally dissolved)
Widowed (including surviving partner from a civil partnership)
In both 2011 and 2001 married people were the largest partnership status group. In 2011, 47 per cent (21.2 million) of the resident adult population were married. This was a decline in proportion from 51 per cent (21.2 million) in 2001 but an increase of 38,000 married people over the decade. A decline in marriage rates has been seen since the 1970s. In 2011 there were also 105,000 people in civil partnerships; this category therefore accounts for the majority of the overall increase of 143,000 for those in legal partnerships (excluding separated people) over the decade. Civil partnerships were introduced as a legal partnership status in 2005. The numbers of people who were formerly in a civil partnership which is now legally dissolved or were the surviving partner from a civil partnership are small; published statistics therefore combined these categories with divorced and widowed people respectively. Subsequent analyses in this report have combined the married and civil partnership categories for analytical purposes3.
The second largest category was single (never married and never been in a civil partnership) for both 2001 and 2011. This category showed the greatest increase in proportion between 2001 and 2011: from 30 per cent (12.5 million) in 2001 to 35 per cent (15.7 million) in 2011.
Divorce statistics show that the number of people getting divorced each year has been generally declining since the mid-1990s. This is in contrast to the number of people aged 60 and over divorcing which rose during this period. In 2011, the usually resident adult population who were divorced4 was 4.1 million (9.0 per cent)5, an increase from 3.4 million (8.2 per cent) in 2001. Widowed was the only category to show declines in both number and proportion: from 3.5 million (8.4 per cent) in 2001 to 3.2 million (7.0 per cent) in 2011.
Household and communal establishment population
Figure 1 shows the marital and civil partnership3 status of the usually resident adult population in England and Wales separately for those resident in households6 and communal establishments7 in 2011. As 98 per cent of usual residents live in households, the marital status distribution of the adult household population was very similar to the usually resident adult population.
Figure 1: Marital and civil partnership status of the resident adult household and communal establishment populations in England and Wales; 2011

Source: Census - Office for National Statistics
Notes:
- Census 2011 tables DC1107EW and DC1116EWla were used to produce figure 1
In 2011, nearly half (48 per cent or 21.2 million) of the adult household population were married or in a civil partnership; a further 2.7 per cent were recorded as separated8 but still legally married (not all separated people would have identified themselves as separated). Over a third (34 per cent or 15.1 million) were single (never married or in a civil partnership), while 9.1 per cent were divorced and the remaining 6.6 per cent were widowed.
In 2011 there were 964,000 usually resident adults (including owners or family members) living in communal establishments7. The marital status distribution of the communal establishment population differs considerably from that of the household population.
The majority (63 per cent or 602,000) of the adult communal establishment population were single, almost double the proportion of the adult household population who were single. This reflects the high proportion of communal establishment residents who are students (living in halls of residence). The second largest marital status group was widowed (or surviving civil partner), accounting for almost one in four (23 per cent or 221,000) of the adult communal establishment population. This was more than three times the proportion of the adult household population who were widowed (6.6 per cent). Communal establishments include nursing and retirement homes which are more likely to accommodate older widowed people; 33 per cent of communal establishments were care homes.
Only 9.0 per cent (87,000)9 of the communal establishment population were married, with a further 1.2 per cent separated but still legally married. This is in contrast to the proportion of the household population who were married (48 per cent). At 4.3 per cent the divorced population in communal establishments was half that of the household population. These differences are largely related to the age structure of the communal establishment population. The majority (77 per cent) of the total communal establishment population (all ages) were living in either educational establishments such as halls of residence (39 per cent) or care homes (38 per cent), and therefore are accommodating younger adults (who are more likely to be single) and older adults (who are more likely to be widowed).
Notes for marital status overview
The adult population refers to those aged 16 and over.
The usually resident population refers to people who live in the UK for 12 months or more, including those who have been resident for less than 12 months but intend to stay for a total period of 12 months or more. The population base for the 2011 Census was the usually resident population of England and Wales, defined as anyone who, on the night of 27 March 2011, was either (a) resident in England and Wales and who had been resident, or intended to be resident in the UK for a period of 12 months or more, or (b) resident outside the UK but had a permanent England and Wales address and intended to be outside the UK for less than a year. Those aged 16 and over will be referred to throughout this report as the adult population.
For analytical purposes data for married people in 2011 has been combined with civil partnership data. Civil partnerships were introduced in 2005 and therefore there were no civil partnerships included in the 2001 Census data.
In 2011 married includes civil partnerships, divorced includes formerly in a civil partnership which is now legally dissolved. In 2011 widowed includes surviving partner from a civil partnership.
ONS publication policy is for percentages under 10 per cent to be rounded to one decimal place; those of 10 per cent or greater are rounded to the nearest whole number.
Definition of a household: one person living alone; or a group of people (not necessarily related) living at the same address who share cooking facilities and share a living room or sitting room or dining area. The household population excludes those persons living in a communal establishment.
A communal establishment is an establishment providing managed residential accommodation. ‘Managed’ in this context means full-time or part-time supervision of the accommodation. Communal establishments include sheltered accommodation units, hotels, guest houses, B&Bs and inns and pubs, and all accommodation provided solely for students (during term-time). More information is available in the 2011 Census Definitions. Communal establishment population includes owners/staff and their families who are living on the premises.
Those who are separated (whether legally or not) remain legally married. While some people may be legally separated, some people who are physically and practically separated will not have this legal status. The Census is self reported, and respondents may have interpreted the question differently. Of those who are effectively, but not legally separated, some may have considered themselves separated, while others may have considered themselves married.
Some percentages or numbers throughout this report may not sum due to rounding.
5. Age and sex distribution by marital status
Changes in marital status distribution between 2001 and 2011 relate to changes in the overall age and sex distribution in the usually resident adult population of England and Wales. The population is ageing (adult median age1 increased from 43.9 in 2001 to 44.9 in 2011); male life expectancy is increasing at a greater rate than female life expectancy and therefore in 2011 there were more older married2 couples and fewer widows compared to 2001. Other factors may include cultural differences and changes in attitudes towards cohabitation, separation and divorce. Figures 2a and 2b show the marital status distribution by age and sex for the usually resident population in 2001 and 2011.
Figure 2a: Population pyramid for those aged 16 and over by legal partnership status for the usually resident population in England and Wales; 2001

Source: Census - Office for National Statistics
Notes:
- Census 2001 table S002 was used to produce figures 2a
Figure 2b: Population pyramid for those aged 16 and over by legal partnership status for the usually resident population in England and Wales; 2011

Source: Census - Office for National Statistics
Notes:
- In 2011 married includes civil partnerships. Separated, divorced and widowed include the equivalent civil partnership statuses.
- Census 2011 table DC1107EW was used to produce figure 2b.
The age distributions of those married in 2001 and 2011 show that the proportion of the population aged 60 and over who were married increased between 2001 and 2011, while the proportion of the population aged under 45 who were married decreased over the same period. This may relate to an increase in average age at marriage and increased cohabitation.
The median age3 of married adults (excluding civil partnered) increased from 50.7 in 2001 to 52.8 in 2011. The median age for married women in 2011 was younger, at 51.5 years, compared to 53.9 years for married men; this relates to previous research showing that men were more likely to marry younger women. The median age for adults in civil partnerships was younger at 43.7 in 2011.
Figure 3 shows that the proportion of people who were single in 2011 was higher than in 2001 for all age groups under 65: the proportion of people aged 30 to 49 who were single increased from 24 per cent in 2001 to 31 per cent in 2011. This pattern is very similar for men and women. This may relate to a reduction in marriage rates and increased age at first marriage as more people are remaining single or cohabiting.
Figure 3: Proportions of the usually resident adult population of England and Wales who were single (never married by age group); 2001 and 2011
; 2001 and 2011")
Source: Census - Office for National Statistics
Notes:
- Census 2011 tables DC1107EW and Census 2001 table SO1 were used to produce figure 3.
Figure 4 shows that those aged under 50 were less likely to be divorced in 2011 when compared with 2001, while those aged 50 and over were more likely to be divorced; 9.2 per cent of people aged 50 and over were divorced in 2001, rising to 13 per cent in 2011. Men and women showed similar patterns. Reasons for this increase may include: later marriage, improved life expectancy leading to partnerships surviving to an older age and therefore the potential to divorce at an older age, and people who have divorced choosing to cohabit rather than re-marry (therefore remaining divorced).
In contrast, of people aged 30 to 39, those who were divorced saw a 3.2 percentage point decrease, from 9.1 per cent in 2001 to 5.9 per cent in 2011. Again men showed a similar pattern to women. This corresponded to an increase in the population remaining single in this age group, again relating to a reduction in marriage rates, increased age at first marriage and increased cohabitation.
Figure 4: Proportions of the usually resident adult population of England and Wales who were divorced; 2001 and 2011

Source: Census - Office for National Statistics
Notes:
- Census 2011 tables DC1107EW and Census 2001 table SO1 were used to produce figure 4.
Notes for age and sex distribution by marital status
Adult median age calculated on single year of age (SYOA) using Census 2011 table QS103EW and 2001 table SO1.
In 2011 married includes civil partnerships, divorced includes dissolved civil partnerships and widowed includes surviving civil partners.
Adult median age for marital status calculated by 5 year age groups using Census 2011 table DC1107EW. Median age calculated using grouped data may differ slightly from the median age calculated using single year of age data due to the distribution of populations within the age bands
6. Geographical variation of marital status
Geographical variation in marital status distribution will be affected by the age and sex structure of an area; for example local authorities (LAs) with a high proportion of older females are more likely to have a higher proportion of widows, while those with large student populations are likely to have a higher proportion of the population who are single1.
Seven of the ten local authorities with the highest proportions of the population married were in the South of England and had older populations with adult median ages above that for England and Wales (table 2). The highest proportion married was in East Dorset (59 per cent): the adult median age in this area was 54.6 (well above the national adult median age of 44.9). Seven of the ten lowest proportions of married people were within London, with the lowest proportion in Islington where only one in four of the adult population were married; overall adult median ages were lower in these London boroughs, at around 35 years. The remaining local authorities (Manchester, Nottingham and Brighton and Hove) included universities and therefore also had younger age profiles. For civil partnerships, nine of the top ten local authorities were in London; the remaining local authority was Brighton and Hove.
Table 2: Local authorities with the highest and lowest proportions of married persons in England and Wales; 2011
| Rank | Highest 10 local authorities | Per cent of adults married | Median age of all adults | Lowest 10 local authorities | Per cent of adults married | Median age of all adults |
| 1 | East Dorset | 59.2 | 54.6 | Islington | 24.8 | 34.7 |
| 2 | Chiltern | 58.3 | 49.2 | Lambeth | 26.2 | 35.0 |
| 3 | Hart | 58.2 | 46.5 | Hackney | 26.8 | 34.3 |
| 4 | South Northamptonshire | 58.0 | 47.9 | Southwark | 28.5 | 35.8 |
| 5 | Wokingham | 57.5 | 45.9 | Manchester | 29.4 | 34.2 |
| 6 | North Kesteven | 56.6 | 48.9 | Camden | 29.5 | 36.3 |
| 7 | Mid Suffolk | 56.5 | 49.6 | Hammersmith and Fulham | 29.6 | 35.3 |
| 8 | Hambleton | 56.4 | 50.2 | Tower Hamlets | 31.6 | 31.6 |
| 9 | Surrey Heath | 56.2 | 46.4 | Nottingham | 31.6 | 36.6 |
| 10 | Harborough | 56.2 | 48.3 | Brighton and Hove | 31.8 | 39.9 |
| Source: 2011 Census, Office for National Statistics | ||||||
| Notes: | ||||||
| 1. Census 2011 table DC1107EW was used to produce table 2. | ||||||
Download this table Table 2: Local authorities with the highest and lowest proportions of married persons in England and Wales; 2011
.xls (34.8 kB)An interactive map is available showing the distribution of single persons (never married or never in a civil partnership) in England and Wales in 2011. Eight of the top ten local authorities were within London, the highest proportion in Islington at 60 per cent; the remaining local authorities were Manchester and Oxford. The high proportions of the population who were single reflect the younger age structures of the local populations, where the median age for the adult population ranged from 31.6 in Tower Hamlets to 36.3 years in Camden. The interactive map also shows the distribution of ‘single (not married)’ which includes all those not in a legal partnership. This combines those single (never in a legal partnership), divorced and widowed.
By contrast, East Dorset had the lowest proportion of the population who were single at 21 per cent (East Dorset also had the highest proportion who were married). Many of the areas with low proportions of single population had older age structures and had high proportions of the population who were widowed.
Table 3 presents the ten local authorities with the highest and lowest proportions of the adult population who were divorced. The top ten were all in coastal areas, and mainly on the South coast of England apart from Blackpool and Great Yarmouth. The top ten all had higher median ages of the adult resident population than England and Wales (44.9 years), ranging from 46.0 (Gosport) to 51.5 in the Isle of Wight. Higher levels of divorced population may relate to the affordability of housing and living costs in some of these areas resulting in divorced people with reduced economic assets living there. A previous ONS publication highlighted some of these coastal areas as having high levels of deprivation.
Eight of the ten lowest local authorities for divorced adults were London boroughs; the other two were Oxford and Cambridge. However all of the lowest ten local authorities had a younger age structure, with an adult median age ranging from 31.6 in Tower Hamlets to 42.4 in Harrow. Other factors may include ethnicity and cultural factors such as attitudes towards divorce. Newham, Brent, Ealing, Harrow and Tower Hamlets all had the lowest proportions of white British, with Harrow and Brent having the highest proportions of Indian ethnicity.
Table 3: Local authorities with the highest and lowest proportions of divorced persons in England and Wales; 2011
| Rank | Highest 10 local authorities | Per cent of adults divorced | Median age of all adults | Lowest 10 local authorities | Per cent of adults divorced | Median age of all adults |
| 1 | Blackpool | 13.1 | 47.3 | Harrow | 5.4 | 42.4 |
| 2 | Hastings | 12.8 | 46.2 | Tower Hamlets | 5.6 | 31.6 |
| 3 | Torbay | 12.2 | 51.0 | Newham | 6.2 | 33.6 |
| 4 | Weymouth and Portland | 12.1 | 49.3 | Redbridge | 6.2 | 40.6 |
| 5 | Thanet | 11.9 | 49.1 | Brent | 6.2 | 38.1 |
| 6 | Isle of Wight | 11.6 | 51.5 | Oxford | 6.4 | 33.7 |
| 7 | Gosport | 11.5 | 46.0 | Wandsworth | 6.5 | 34.8 |
| 8 | Eastbourne | 11.5 | 48.3 | Cambridge | 6.6 | 34.6 |
| 9 | Great Yarmouth | 11.4 | 49.0 | Ealing | 6.8 | 38.9 |
| 10 | Worthing | 11.2 | 47.5 | Merton | 6.9 | 39.5 |
| Source: 2011 Census, Office for National Statistics | ||||||
| Notes: | ||||||
| 1. Census 2011 table DC1107EW was used to produce table 3. | ||||||
Download this table Table 3: Local authorities with the highest and lowest proportions of divorced persons in England and Wales; 2011
.xls (34.8 kB)The top six local authorities with the highest proportions of the adult population who were widowed in 2011 were all in the South of England (Rother, Christchurch, Tendring, West Somerset, Arun and East Devon). These areas all had a higher adult median age than the national average, ranging from age 52.2 in Arun to 55.7 in West Somerset. The ten lowest proportions of the population widowed were all in London boroughs, reflecting the younger age structures of these local populations. Median adult ages ranged from 31.6 in Tower Hamlets to 41.4 in City of London.
Widows represented 10 per cent of the adult female population in 2011, compared with widowers representing 3.3 per cent2 of the adult male population. This difference is related to the variations between male and female life expectancy, and the tendency for men to be married to women younger than themselves. The majority (77 per cent or 2.4 million) of widowed people in 2011 were female, a decrease from 79 per cent in 2001 (2.7 million). This change may relate to the greater rate of increase in male life expectancy in recent years relative to the female increase.
Notes for geographical variation of marital status
- Single (never married or never registered in a same-sex civil partnership).
- Some percentages or numbers throughout this report may not sum due to rounding.
7. Marital status comparisons within the United Kingdom
Figure 5 summarises the marital status patterns of the four UK countries. The proportions of single and married people varied little between the countries and almost half (45 to 48 per cent) of the populations of all four countries were married. The proportion of the populations in civil partnerships was highest in England (0.2 per cent) and double that of the lowest, Northern Ireland (0.1 per cent). Northern Ireland had the highest proportion separated (4.0 per cent) and the lowest proportion divorced (5.5 per cent); by contrast, Wales had the lowest proportion separated (2.2 per cent) and highest proportion divorced (9.7 per cent). This may reflect cultural differences in attitudes towards marriage between the UK countries. The proportion widowed varied little across the UK (between 6.8 in Northern Ireland and 7.9 per cent in Wales).
Figure 5: Legal marital status of population aged 16 and over for the UK and constituent countries, 2011

Source: Census - Office for National Statistics, National Records of Scotland, Northern Ireland Statistics and Research Agency
Notes:
- Percentages in the category ‘In a registered same-sex civil partnership’ were very small for all four UK countries ranging from: 0.09 per cent (Northern Ireland) to 0.23 per cent (England). For Northern Ireland the level is so low that it is not visible on the figure.
- Census 2011 table DC1107EW, NISRA table DC1103NI and NRS table KS103SC were used to produce figure 5.
8. European marital status comparisons
Figure 6 shows the legal marital status of the population of selected European Union and European Economic Area (EU/EEA) and EU candidate countries available from Eurostat for 2011 in comparison to the marital status distribution of England and Wales. Countries are presented in alphabetical order. England and Wales ranked 12th for divorced persons (9.0 per cent), just above the overall proportion for these countries (7.2 per cent) with similar levels to Switzerland and Liechtenstein; Latvia had the highest proportion (14 per cent) and Malta the lowest (0.3 per cent).
A similar proportion of the population were widowed in England and Wales (7.0 per cent) compared with the overall proportion widowed (7.6 per cent). The highest level of widowhood was for Hungary (11 per cent), and the lowest in Iceland (4.7 per cent). Differences may be partly related to poor life expectancy in the male populations of many Central and Eastern European countries relative to females.
Single people generally accounted for higher proportions of the population in Northern Europe including England and Wales (35 per cent); conversely, the proportion married was lowest in these countries (England and Wales 49 per cent). By contrast the proportion of single people was generally lower in Southern and Eastern Europe. This may reflect cultural differences and attitudes towards marriage and cohabitation.
Figure 6: Legal marital status of the populations of selected EU/EEA and candidate countries, 2011

Source: Census - Office for National Statistics, Eurostat
Notes:
- Data are as at 1st January 2011.
- Data for Malta are for 2010.
- The data for some countries included the category ‘unknown marital status’; for analysis purposes this category was excluded from the total.
- Countries included are those with data available via Eurostat. EEA countries are: Iceland, Liechtenstein, Norway, and Switzerland. The sole EU candidate country is Turkey. The remaining countries included are EU members.
- Eurostat table was used to produce figure 6.
- Married, divorced and widowed include the civil partnership equivalent.
9. Living arrangements for the household population
What were the living arrangements of married people?
In 2011, 46 per cent (20.4 million) of the household population aged 16 or over were living together and married1, a relative decrease from 51 per cent (20.6 million) in 2001. This was 96 per cent and 98 per cent of the married household population in 2011 and 2001 respectively.
In 2011 3.7 per cent (785,000) of the married population were not living together as a married couple. Of these, 82 per cent (640,000) said that they were married or civil partnered, not separated and not living in a couple, while the remaining 18 per cent (145,000) were cohabiting with a different partner (these people are likely to be separated even though they have not declared themselves to be separated). There was a 71 per cent increase in those stating that they were married or civil partnered, not separated and not living in a couple, rising from 375,000 in 2001 to 640,000 in 2011. The increase in those who were ‘living apart together’ may correspond to having another residence either within the UK or abroad (for example related to their employment situation), or partners working or living abroad or being resident in a communal establishment.
Figure 7 shows the difference in age distribution between those who were married and living together and those who were married and not living together as a couple. Those cohabiting with someone other than their spouse are excluded. Those married and not living together as a couple have a younger age structure: 38 per cent were under 40, compared with 21 per cent of those who were living in a couple. This may relate to people living separately for employment purposes.
People aged 80 and over accounted for a greater proportion of those who were married and not living as a couple (7.1 per cent) compared with 4.0 per cent of those who were married and living as a couple. This is most likely due to partners moving into care homes.
Figure 7: Age distribution of the adult household population who were married or in a civil partnership by living arrangement in England and Wales, 2011
Source: Census - Office for National Statistics
Notes:
- Census 2011 table DC1108EW was used to produce figure 7
Download this chart Figure 7: Age distribution of the adult household population who were married or in a civil partnership by living arrangement in England and Wales, 2011
Image .csv .xlsMap 1 shows the proportion of the adult population married but not living in a couple by local authority. The highest concentrations of those not living in a couple either married or in a civil partnership were found in London, with the highest percentage in the City of London (17 per cent). Slough, Manchester, Leicester and Luton were the highest ranking areas outside London with Cardiff ranking highest in Wales.
These large urban areas are likely to have high proportions of married people living apart from their partner due to work. Some of these areas such as Newham, Brent and Leicester also have high proportions of the population born in South Asia who have migrated to the UK, but whose spouses may still live abroad. Some 23 per cent of people in Newham were born in Southern Asia (where a total of 54 per cent of the population were born abroad), while 16 per cent of people in Brent were born in Southern Asia (where a total of 55 per cent of the population were born abroad).
Map 1: Percentage of the married population aged 16 and over who were not living in a couple (not separated); local authorities, 2011

Source: Census - Office for National Statistics
Download this image Map 1: Percentage of the married population aged 16 and over who were not living in a couple (not separated); local authorities, 2011
.png (446.3 kB) .png (446.3 kB)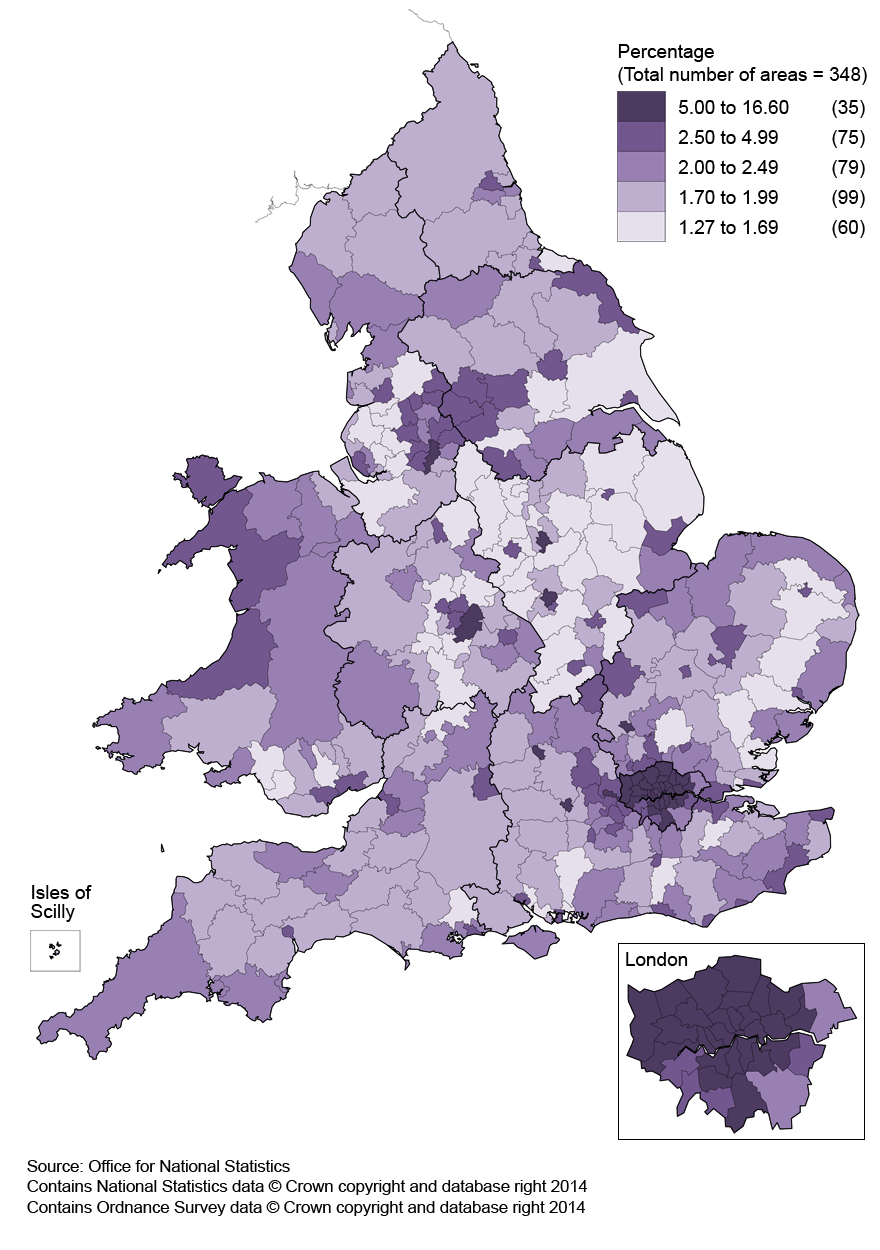
What are the characteristics of the cohabiting population?
In 2011, 12 per cent (5.3 million) of the adult household population of England and Wales were living in a cohabiting couple; this was an increase from 9.8 per cent (4.0 million) in 2001.
The largest age group for those cohabiting in both 2011 and 2001 were those aged 25 to 29 (figure 8). However the proportion of all cohabiting people who are in this age group declined from 22 per cent (862,000) in 2001 to 19 per cent (1.0 million) in 2011, as a result of increasing proportions in older age groups.
Figure 8: Age distribution of the adult household population who were cohabiting in England and Wales, 2001 and 2011
Source: Census - Office for National Statistics
Notes:
- Census 2011 table DC1108EW and 2001 table S004 were used to produce figure 8
Download this chart Figure 8: Age distribution of the adult household population who were cohabiting in England and Wales, 2001 and 2011
Image .csv .xlsThose aged 40 and above made up a larger proportion of the cohabiting household population in 2011 (41 per cent, 2.2 million) than in 2001 (31 per cent, 1.2 million) as a result of the ageing population. Of those who were cohabiting in 2011 the median age was 36.2, an increase from 33.6 in 2001. In 2011, cohabiting females were younger with a median age of 34.8 years compared with cohabiting males (37.4 years).
Cohabiting people accounted for 8.0 per cent of the household population age 40 and over in 2011, an increase from 5.2 per cent in 2001. The age group 40 to 49 saw the largest increase in people cohabiting (from 9.4 per cent in 2001 to 14 per cent in 2011), while the cohabiting population aged 60 to 64 saw the largest percentage increase between 2001 and 2011 (122 per cent). Increases in the age group 60 to 64 relate to an overall increase in the population in this age group (33 per cent). Possible reasons for increased cohabitation in the population aged 40 and over include: increasing numbers of divorced people who choose to cohabit rather than re-marry and the increased social acceptability of cohabitation.
Table 4 presents the ten local authorities with the highest and lowest proportions of those cohabiting in the adult household population; the local authorities with the highest proportions of the population cohabiting were Norwich and Brighton and Hove (both at 16 per cent), with the rest distributed across England. Eight of the ten areas with the lowest proportions were London boroughs, with the lowest levels in Harrow (5.7 per cent) and Redbridge (6.9 per cent). These areas correspond respectively to areas with the highest and lowest levels of people stating that they had ‘no religion’ highlighted in previous ONS research.
Table 4: Local authorities with the highest and lowest proportions of cohabiting adults and percent of no religion in their total population; 2011
| Cohabiting Rank | Highest 10 local authorities | Per cent of adults cohabiting | Per cent of population with no religion | Lowest 10 local authorities | Per cent of adults cohabiting | Per cent of population with no religion |
| 1 | Norwich | 16.3 | 42.5 | Harrow | 5.7 | 9.6 |
| 2 | Brighton and Hove | 15.9 | 42.4 | Redbridge | 6.9 | 11.0 |
| 3 | Lincoln | 15.8 | 32.6 | Newham | 7.5 | 9.5 |
| 4 | Corby | 15.5 | 33.3 | Brent | 7.6 | 10.6 |
| 5 | Kingston upon Hull | 15.4 | 34.8 | Barnet | 8.3 | 16.1 |
| 6 | Ipswich | 15.2 | 35.0 | Enfield | 8.4 | 15.5 |
| 7 | Islington | 15.2 | 30.0 | Chiltern | 8.8 | 23.6 |
| 8 | Wandsworth | 14.9 | 27.0 | East Dorset | 8.8 | 24.2 |
| 9 | Hastings | 14.6 | 36.6 | Ealing | 8.9 | 15.0 |
| 10 | Cannock Chase | 14.6 | 23.7 | Hillingdon | 9.1 | 17.0 |
| Source: 2011 Census, Office for National Statistics | ||||||
| Notes: | ||||||
| 1. Census 2011 tables DC1108EW and DC2107EW were used to produce table 4. | ||||||
| 2. Percentage of the population with no religion refers to those age 3 and over. | ||||||
Download this table Table 4: Local authorities with the highest and lowest proportions of cohabiting adults and percent of no religion in their total population; 2011
.xls (35.3 kB)In 2011, the majority (69 per cent or 3.7 million) of the cohabiting2 population were single (never married or in a civil partnership); a further 21 per cent (1.1 million) were divorced. Those still legally married (including separated) accounted for 7.3 per cent (388,000), while a further 2.6 per cent (136,000) were widowed (figure 9).
Figure 9: Marital status of the adult household population cohabiting in England and Wales; 2011

Source: Census - Office for National Statistics
Notes:
- Census 2011 tables DC1107EW, DC1108EW and DC1116EW were used to produce figure 9.
What are the characteristics of those not living as a couple?
In 2011, 42 per cent (18.8 million) of the adult household population of England and Wales were not living as a couple; this was an increase from 39 per cent (16 million) in 2001. The marital status of those not living as a couple had changed little since 2001. The proportion of those not living as a couple and single rose from 58 per cent to 61 per cent, while the proportion widowed fell from 19 per cent to 15 per cent. There were small increases in the proportions married, separated and divorced.
The proportion of adult males aged 16 and over not living as a couple was 41 per cent (8.8 million) in 2011; the equivalent female proportion was 44 per cent (10.0 million). The median ages of these two groups were 33.1 years for males and 42.7 years for females respectively, reflecting the greater life expectancy in the female population, and the higher proportion of widows.
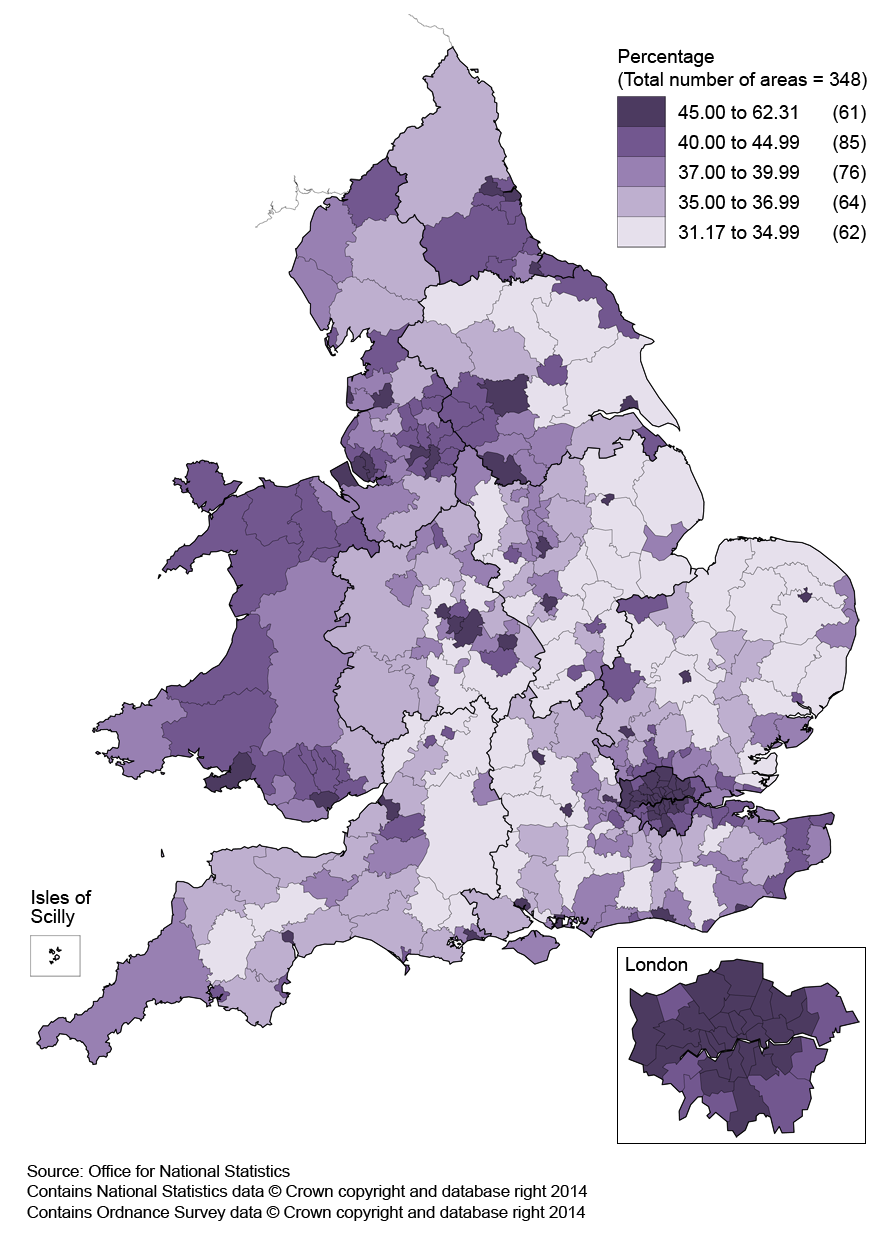
Map 2 summarises the variation in percentage levels for the usually resident adult household population who were not living as a couple in 2011 in England and Wales; nine of the top ten local authorities with the highest adult household population proportions not living as a couple were in London; many university towns and cities (including Manchester) also had the highest levels not living as a couple. Knowsley (Merseyside), Blackpool, Middlesbrough and Hastings also had high levels; Knowsley was identified in an earlier publication for its high level of lone parents living in multi-family households. In Wales, Cardiff had the highest level, ranking 34th overall in England and Wales.
Map 2: Percentage of those aged 16 and over who were not living as a couple; local authorities, 2011
Source: Census - Office for National Statistics
Download this image Map 2: Percentage of those aged 16 and over who were not living as a couple; local authorities, 2011
.png (445.3 kB) .png (445.3 kB)
Figure 10 summarises the age distribution of the adult population of England and Wales living in households and not living as a couple in 2001 and 2011. In 2011, 39 per cent (7.4 million) of these were aged under 30 years and a further 20 per cent (3.7 million) aged 65 and over. The largest percentage increases occurred in the age range 40 to 64 years, with a 54 per cent increase in the 45 to 49 years group from 789,000 in 2001 to 1.2 million in 2011. Recent research has identified that age groups 40 to 44 and 45 to 49 accounted for the highest number of divorces in 2012.
Figure 10: Age profiles of the adult household population not living as a couple; England and Wales; 2001 and 2011
Source: Census - Office for National Statistics
Notes:
- Census 2011 table DC1108EW and 2001 table S004 were used to produce figure 10
Download this chart Figure 10: Age profiles of the adult household population not living as a couple; England and Wales; 2001 and 2011
Image .csv .xlsFigure 11 further divides people not living as a couple by age groups and into marital status categories: the younger age groups are dominated by single people, while older groups have more divorced and widowed people.
Figure 11: Marital status breakdown by age for the adult household population not living as a couple; England and Wales 2011
Source: Census - Office for National Statistics
Notes:
- Census 2011 table DC110EW was used to produce figure 11
Download this chart Figure 11: Marital status breakdown by age for the adult household population not living as a couple; England and Wales 2011
Image .csv .xlsNotes for living arrangements for the household population
- ‘Married’ is used to refer to those who are married or in civil partnerships; the latter were introduced in 2005; and so there were no civil partnerships in 2001.
- Cohabiting is not a legal partnership status, therefore those cohabiting may be categorised as single, separated, divorced or dissolved civil partnership, widowed or surviving civil partner or married or in a registered civil partnership.
10. United Kingdom comparison of living arrangements
More than half the household populations aged 16 and over in all four UK countries were living as a couple in 2011, either married or cohabiting (figure 10). The lowest proportion cohabiting was in Northern Ireland (6.2 per cent); the highest proportion was in England (11.9 per cent).
For those not living as a couple, those who were single was the biggest group in all four countries, and was highest of all in Northern Ireland at 31 per cent. For those married but not living in a couple, England had the highest proportion (1.5 per cent) and Scotland the lowest proportion (0.8 per cent). While the proportion widowed in all four countries was similar (ranging from 6.3 in England to 7.2 per cent in Wales), the proportion divorced was highest in Wales (7.2 per cent) and lowest in Northern Ireland (4.5 per cent).
Figure 12: Living arrangements for the household populations aged 16 and over for the UK and constituent countries, 2011

Source: Census - Office for National Statistics, National Records of Scotland, Northern Ireland Statistics and Research Agency
Notes:
- Percentages in the category ‘Not living in a couple: Married/civil partnership’ were very small for all four UK countries, ranging from: 0.8 per cent (Scotland) to 1.5 per cent (England), and are not labelled in the figure.
- Census 2011 table DC1108EW, NISRA table DC1105NI and NRS KS104SC were used to produce figure 12.