1. Main points
The whole economy Index of Labour Costs per Hour (ILCH), seasonally adjusted, increased by 4.0% in Quarter 3 July to Sept of 2015, compared with the same quarter of 2014 and 1.2% compared with the previous quarter, Quarter 2 Apr to June 2015
Wage costs per hour worked increased by 3.6% in the third quarter of 2015 on the same quarter in the previous year and non-wage costs per hour worked increased by 6.0%
Private sector labour costs per hour increased by 3.9% in the third quarter of 2015 on the same quarter in the previous year, while public sector labour costs per hour increased by 3.2%
The retail, trade and repairs industry had the largest increase in Quarter 3 2015 compared with Quarter 3 2014, with an increase of 9.8%
The food products, beverages and tobacco industry had the largest decrease in Quarter 3 2015 compared with Quarter 3 2014, with a decline of 4.0%
2. Summary
The Index of Labour Costs per Hour (ILCH) is a measure of the cost of having an employee for an hour of work. It represents the total cost of employing an individual, which is primarily the earnings of the employee, but also includes non-wage costs. It is also known as the Labour Cost Index (LCI); the index is produced by all member countries of the EU and collated by Eurostat.
Four versions of ILCH are calculated for each aggregate, both seasonally adjusted and non-seasonally adjusted, measuring changes in:
total labour costs per hour worked
wage costs per hour worked
other labour costs, including benefits in kind and employer social contributions (pension and national insurance contributions, sickness, maternity and paternity pay) per hour worked
total labour costs, excluding bonuses and arrears, per hour worked
The labour cost component of ILCH is mainly drawn from the Monthly Wages and Salaries Survey (MWSS); the hours worked component of ILCH is drawn from the Labour Force Survey (LFS). Other costs are estimated using a range of other sources including the Annual Business Survey (ABS) and Annual Survey of Hours and Earnings (ASHE). ILCH index figures are estimates in current prices, meaning that they are published not adjusted for inflation.
ILCH statistics are currently designated as experimental. Experimental statistics are those official statistics undergoing further development work before they are submitted for assessment as a National Statistic by the UK Statistics Authority.
This bulletin provides information on the seasonally adjusted ILCH series. Seasonally adjusted results were first published in March 2015 in the Quarter 4 Oct to Dec 2014 bulletin, for the full series from Quarter 1 Jan to Mar 2000 and this will continue to be the case in all future ILCH bulletins. Non-seasonally adjusted data can be found on our website.
Back to table of contents3. Sector growth
Year on year
Whole economy labour costs per hour increased by 4.0% in Quarter 3 July to Sept 2015 compared with the same quarter a year earlier, before inflation is taken into account. Total labour costs include wages and salaries, benefits in kind and employer social contributions (pension and national insurance contributions, sickness, maternity and paternity pay).
The growth in wage costs per hour worked on the same quarter a year earlier was 3.6% and non-wage costs per hour worked increased by 6.0%. The increase in non-wage costs is partly a result of an increase in sickness, maternity and paternity pay, particularly in the services industry. Wage costs include benefits in kind, wages and salaries. Non-wage costs include sickness, maternity and paternity pay, national insurance contributions and pension contributions.
Private sector labour costs (per hour) increased by 3.9% in Quarter 3 July to Sept 2015 and public sector labour costs (per hour) increased by 3.2% in Quarter 3 July to Sept 2015 compared with the same quarter a year earlier; this series can be volatile due to small numbers included in the sample.
Figure 1.1 shows the annual change in labour costs (per hour) for the whole economy, private and public sector.
Figure 1.1: Labour Costs per Hour year on year growth - whole economy, private sector and public sector
UK, Quarter 1 (Jan to Mar) 2009 to Quarter 3 (July to Sept) 2015
Source: Annual Business Survey (ABS), Annual Survey of Hours and Earnings (ASHE), Labour Force Survey, Monthly Wages and Salaries Survey - Office for National Statistics
Notes:
- Throughout this release Q1 refers to Quarter 1 (January to March), Q2 refers to Quarter 2 (April to June), Q3 refers to Quarter 3 (July to September) and Q4 refers to Quarter 4 (October to December).
- p = provisional, r = revised.
Download this chart Figure 1.1: Labour Costs per Hour year on year growth - whole economy, private sector and public sector
Image .csv .xlsQuarter on quarter
Compared with the previous quarter, Quarter 2 Apr to June 2015, whole economy labour costs per hour increased by 1.2% in Quarter 3 July to Sept 2015. Private sector labour costs increased by 1.0% and public sector labour costs increased by 1.6%.
Total wage costs grew by 1.2% in Quarter 3 July to Sepy 2015 compared with the previous quarter and total other costs increased by 1.3%.
Figure 1.2 highlights the quarterly change in labour costs per hour for the whole economy, private secor and public sector.
Figure 1.2: Labour Costs per Hour quarter on quarter growth - whole economy, private sector and public sector
UK, Quarter 1 (Jan to Mar) 2009 to Quarter 3 (July to Sept) 2015
Source: Annual Business Survey (ABS), Annual Survey of Hours and Earnings (ASHE), Labour Force Survey, Monthly Wages and Salaries Survey - Office for National Statistics
Notes:
- Throughout this release Q1 refers to Quarter 1 (January to March), Q2 refers to Quarter 2 (April to June), Q3 refers to Quarter 3 (July to September) and Q4 refers to Quarter 4 (October to December).
- p = provisional, r = revised.
Download this chart Figure 1.2: Labour Costs per Hour quarter on quarter growth - whole economy, private sector and public sector
Image .csv .xls4. Trends in whole economy labour costs
Figure 2 shows the 3 indices of whole economy labour costs (per hour) referenced to the year 2000: total labour costs, total wage costs and total other costs.
Total labour costs per hour worked and wage costs per hour worked continue to increase and are quite similar, with an increase of 62.8% and 58.4% since 2000 respectively. This reflects the structure of labour costs in the UK, which is largely driven by wages and salaries.
The path of other labour costs follows that of the total, as might be expected, but at points moves differently, as changes in non-wage costs affect the series. The largest move away from wage costs occurred in Quarter 2 Apr to June 2003, when new national insurance contribution (NIC) rates were introduced. Total other costs per hour have increased by 93.7% since 2000; the largest growth in the series.
Figure 2: Whole economy Index of Labour Costs per Hour, by component
UK, Quarter 1 (Jan to Mar) 2000 to Quarter 3 (July to Sept) 2015

Source: Annual Business Survey (ABS), Annual Survey of Hours and Earnings (ASHE), Labour Force Survey, Monthly Wages and Salaries Survey - Office for National Statistics
Notes:
- Throughout this release Q1 refers to Quarter 1 (January to March), Q2 refers to Quarter 2 (April to June), Q3 refers to Quarter 3 (July to September) and Q4 refers to Quarter 4 (October to December).
Download this image Figure 2: Whole economy Index of Labour Costs per Hour, by component
.png (18.8 kB) .xls (33.8 kB)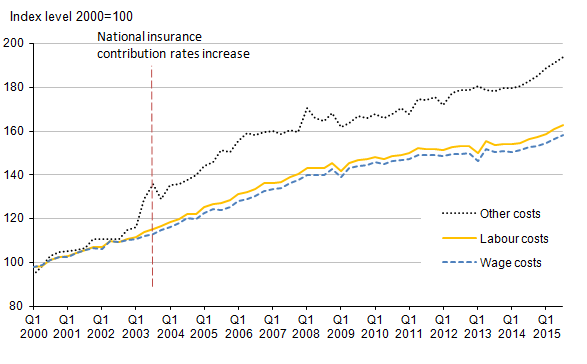
5. Industry growth
Year on year
The industry with the highest growth in labour costs was retail, trade and repairs, with labour costs per hour having increased by 9.8% in Quarter 3 July to Sept 2015 compared with a year earlier. This growth in labour costs is in part due to increases in costs of wages and national insurance contributions per hour. Additionally this figure has been affected by the fact that Quarter 3 July to Sept 2014 had an unusually low growth.
The finance and insurance industry experienced the second largest growth in labour costs per hour in Quarter 3 2015, with an increase of 9.2% compared with a year ago. Other industries that experienced growth in Quarter 3 2015 include construction, arts, entertainment and recreation and textiles, leather and clothing.
The food products, beverages and tobacco industry, in the manufacturing sector, experienced a decline in labour costs in Quarter 3 2015 compared with a year earlier; labour costs (per hour) in this industry decreased by 4.0%. This figure is partially affected by the fact that Quarter 3 July to Sept 2014 had an unusually high growth.
Real estate activities and electricity, gas and water supply also experienced decreases in labour costs compared with Quarter 3 July to Sept 2014.
Figure 3.1: Labour costs (per hour) year on year growth by industry
UK, Quarter 3 (July to Sept) 2015
Source: Annual Business Survey (ABS), Annual Survey of Hours and Earnings (ASHE), Labour Force Survey, Monthly Wages and Salaries Survey - Office for National Statistics
Download this chart Figure 3.1: Labour costs (per hour) year on year growth by industry
Image .csv .xlsQuarter on quarter
The industry with the highest quarterly growth in labour costs was textiles, leather and clothing, with labour costs per hour having increased by 8.9% in Quarter 3 July to Sept 2015 compared with Quarter 2 Apr to June 2015.
Mining and quarrying experienced the second largest growth in labour costs per hour in Quarter 3 2015, with an increase of 8.5% compared with the previous quarter. Other industries that experienced growth in Quarter 3 2015 include arts, entertainment and recreation, and finance and insurance.
Food products, beverage and tobacco experienced the greatest decline in labour costs in Quarter 3 2015 compared with Quarter 2 2015. Labour costs (per hour) in this industry decreased by 2.5% on the quarter. Labour costs per hour in administrative and support service activities declined by 2.0%. Chemicals and man-made fibres, and electricity, gas and water supply also experienced decreases in labour costs compared with the previous quarter.