
Table of contents
- Main points
- Overview
- Important terms
- Calculating capital stocks and consumption of fixed capital
- What do you think?
- Capital stocks and consumption of fixed capital in detail
- Analysis by institutional sector
- Analysis by type of asset
- Analysis by industry
- Capital output ratio analysis
- Net capital stocks per employee
- Background notes
- Methodology
1. Main points
The United Kingdom’s (UK) net capital stock was estimated at £4.1 trillion at the end of 2014. Between 1998 and 2007, average annual growth was 2.2% but this fell between 2008 and 2014 to 1.1%. Since 1997, estimates of net capital stocks increased by £1.0 trillion (33.1%)
Consumption of fixed capital for the UK was estimated at £236 billion in 2014, an increase of £86 billion (57.7%) compared with 1997. The 2014 estimate is now £6 billion (2.4%) higher than the 2007 peak for this series, despite the fall in the economic downturn period between 2008 and 2009
Services industries held an estimated 77.4% of total net capital stocks at the end of 2014. The construction industry held an estimated 8.3% and manufacturing held 6.1%. Other production industries accounted for the remaining 8.2% of net stocks held
A number of methodological improvements have been introduced in this release; these were detailed in 2 articles titled ‘methodological changes to estimation of capital stocks’ and ‘impact of the methodological changes to capital stocks’ published on 14 September and 1 December respectively. The links to these articles are contained within the background notes
2. Overview
A number of methodological improvements were introduced for this publication, therefore the timeseries has been revised back to 1997. Users are advised to consult the background notes and articles detailing methodological improvements (269.4 Kb Pdf) and impact of the methodological improvements (235.4 Kb Pdf) for details on these changes.
Also published as part of this release are estimates of gross capital stocks, net capital stocks and consumption of fixed capital by institutional sector, asset and industry level. Further information on the detailed classification of these 3 areas can be found in our publication of concepts, sources and methods.
All data referred to in this bulletin are annual estimates of chained volume measures (CVM) unless otherwise specified. These are time series put in real terms by computing the volume of each year in the prices of the preceding year. The data are then chained together to obtain a time series of production figures from which the effect of price changes have been removed. The CVMs in this publication are referenced to 2012.
Back to table of contents3. Important terms
Capital stocks represent the value of all fixed assets used in production in the economy that are still in use, such as machinery, dwellings and intellectual property products, formerly intangible fixed assets, such as software.
Economic assets are a store of value representing the benefits the economic owner will get by holding or using the asset over a period of time.
Fixed assets are non-financial items which are used repeatedly in the process of production for more than one year. For example, a machine on a production line or software used in production.
Gross capital stocks tell us how much the economy’s assets would cost to buy again as new, or their replacement cost. All of the fixed assets in the economy, that are still productive and in use, are added up to calculate this, regardless of how old they are or how much they may have deteriorated since they were first used. This measure shows the value at the end of the year. This is mainly calculated as an intermediate step towards net capital stocks but individually provides a broad indicator of the productive capacity of an economy.
Net capital stocks show the market value of fixed assets. The market value is the amount that the assets could be sold for, which will be lower than the value of gross capital stocks. This reflects the fact that the assets will have had some wear and tear compared to a new asset. This measure shows the value at the end of the year. This measure is used in preference to gross capital stocks as it provides a valuation of assets in the economy after the removal of depreciation.
The consumption of fixed capital is the decline in the value, or depreciation, of fixed assets in the economy over a time period. The decline in value can be due to wear and tear, assets no longer being used, or normal accidental damage. It can also be described as the quantity (or value) of the capital stocks which is used up in that period. Whilst these data are interesting, their primary purpose is to move from various gross measures of economic flows to the corresponding “net” variable, in particular for production and income (net domestic product, net value added) and a number of demand variables such as net investment.
Gross fixed capital formation (GFCF) is the acquisition less disposals of produced fixed assets; that is assets intended for use in the production of other goods and services for a period of more than a year. Acquisition includes both purchases of assets (new or second-hand) and the construction of assets by producers for their own use. New buildings and dwellings, and major improvements to buildings and dwellings are included in GFCF, but the acquisition and disposal of existing buildings and dwellings are not.
4. Calculating capital stocks and consumption of fixed capital
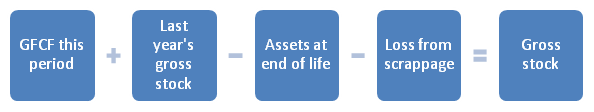
Figure 1 shows how gross capital stocks are calculated using the Perpetual Inventory Method (PIM). The cumulative sum of net investment in assets (GFCF), that is, the capital stock, is calculated by adding investment this period to the capital stock in the previous period and subtracting the value of assets which have reached the end of their useful life or that have been scrapped as a result of bankruptcy. The PIM replicates this process for each industry and asset combination for every year of data in the model.

Figure 2 shows how net capital stocks are calculated. This is also a ‘stock’ measure and estimates the value at the end of the year. The same process that is used for the estimation of gross stocks is used; however, an additional component for depreciation (for example, from wear and tear) is subtracted from the gross value. This can be thought of as the quantity of assets ‘used up’ in a year. At the end of an asset’s service life, its whole value has been ‘used up’, and it no longer contributes to the net (or gross) stock level.

The consumption of fixed capital is an estimate of a ‘flow’. It represents the change in the value of assets during the year. Figure 3 shows that it is made up of the sum of transfer costs (costs associated with purchasing or disposing of an asset) from GFCF, the depreciation or loss in value of assets due to usual wear and tear as well as the value of assets lost when companies go bankrupt. This value is calculated for each year within the model.
Figure 3: Consumption of fixed capital calculation

Download this image Figure 3: Consumption of fixed capital calculation
.png (24.6 kB)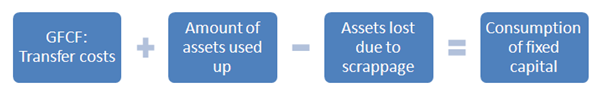
5. What do you think?
We would welcome any feedback you may have, and would be particularly interested in knowing how you make use of these data to inform your work. Please contact us via email: gcf@ons.gov.uk or telephone Jayne Olney on +44 (0)1633 455250.
Back to table of contents6. Capital stocks and consumption of fixed capital in detail
Estimates of capital stocks and the consumption of fixed capital tend to follow a relatively smooth path over time, because they are recorded as accumulated balances. Nevertheless, in cases where the asset price or Gross Fixed Capital Formation (GFCF) have changed significantly, changes in the rate of increase or decrease in the capital stock can be observed.
The level of fixed GFCF investment fell sharply during the economic downturn by 5.9% in 2008 and 14.4% in 2009. Despite this, growth in capital stock remained above the level of depreciation and continued to grow in 2008 and 2009, albeit at slower rates compared with the decade prior to the downturn.
Gross Capital Stocks
Gross capital stocks was estimated at £7.0 trillion at the end of 2014, an increase of 41.3% since 1997 and equivalent to 2.1% growth per annum. In the decade prior to the economic downturn, gross capital stocks rose on average by 2.4% per annum, however this slowed to 1.7% per annum between 2008 and 2009. Gross capital stocks growth increased by 1.5% during the period 2010 to 2014, remaining below rates seen prior to the downturn (Table 1).
Table 1: Average annual growth in capital stocks
| Reference year: 2012 | ||||
| Coverage: United Kingdom | ||||
| Chained volume measures (%) | 1998 - 2007 | 2008 - 2009 | 2010 - 2014 | 1998 - 2014 |
| Gross stock | 2.4% | 1.7% | 1.5% | 2.1% |
| Net stock | 2.2% | 1.2% | 1.0% | 1.7% |
| Consumption of fixed capital | 4.4% | -4.5% | 2.3% | 2.7% |
| Source: Office for National Statistics | ||||
Download this table Table 1: Average annual growth in capital stocks
.xls (32.3 kB)Net Capital Stocks
Net capital stocks account for the depreciation in assets, so both the level and the rate of increase in the net stock will be lower compared with gross stock (Figure 4).
Net capital stocks were estimated at £4.1 trillion at the end of 2014, an increase of 33.1% since 1997 and equivalent to 1.7% growth per annum. The average annual growth in net capital stocks slowed during 2008 and 2009 to 1.2%, compared with 2.2% prior to the downturn. Growth in subsequent years has remained comparatively subdued at 1.0% on average.
Figure 4: Gross and net capital stocks, 1997 to 2014
Reference year: 2012 Coverage: United Kingdom
Source: Office for National Statistics
Download this chart Figure 4: Gross and net capital stocks, 1997 to 2014
Image .csv .xlsConsumption of fixed capital
In 2014, the consumption of fixed capital was estimated at £236 billion, an increase of 57.7% since 1997 (equivalent to an average of 2.7% growth per annum); the largest contribution came from the costs associated with the transfer of ownership of non-produced assets, which increased by 127% between 1997 and 2014. In contrast with the gross and net capital stock estimates, capital consumption is a flow variable and showed negative growth during the economic downturn. The level of consumption of fixed capital peaked in 2007 at £230 billion, but fell by 6.5% and 2.3% in 2008 and 2009 respectively to £210 billion in 2009. This may have been caused by a sharp fall in household transfer costs (costs associated with purchasing or disposing of an asset), which can be attributed to the adverse impact of the financial market shock on the housing market. Growth in the consumption of fixed capital subsequently picked up, albeit at a slower rate compared with pre-downturn rates. In 2014, the level of the consumption of fixed capital was 2.4% (£6 billion) higher than the 2007 peak (Figure 5).
Figure 5: Consumption of fixed capital estimates, 1997 to 2014
Reference year: 2012 Coverage: United Kingdom
Source: Office for National Statistics
Download this chart Figure 5: Consumption of fixed capital estimates, 1997 to 2014
Image .csv .xls7. Analysis by institutional sector
Net capital stocks estimates have been used for this analysis as they are a measure of the market value of fixed assets (what these assets were worth at the time).
The percentage share of net capital stocks owned by the institutional sectors remained relatively stable between 1997 and 2014. At the end of 2014, ‘non-financial corporations’ (NFCs) were estimated to have held the largest share of total net capital stock at £1.7 trillion (41.1%), followed by households and NPISH sectors which held an estimated £1.6 trillion (38.7%) of assets. NFCs held the largest number of assets in ‘other buildings and structures’, at £0.8 trillion (49.8% of total net capital stock held by NFCs). Households and NPISH primarily held assets in dwellings (excluding land) at £1.5 trillion (94.1%) of total net capital stock held by households and NPISH).
Figure 6: Net capital stocks estimates by institutional sector, 1997 and 2014
Reference year: 2012 Coverage: United Kingdom
Source: Office for National Statistics
Notes:
- NPISH stands for non-profit institutions serving households, such as universities and charities.
Download this chart Figure 6: Net capital stocks estimates by institutional sector, 1997 and 2014
Image .csv .xlsFigure 6 and Table 2 show that all institutional sectors experienced growth in net capital stocks between 1997 and 2014, albeit at different rates. In percentage terms, general government was the headline sector that experienced the strongest growth at 63.6% (equivalent to 2.9% on average per annum), followed by NFCs at 35.0% (equivalent to 1.8% on average per annum), and financial corporations at 33.9% (equivalent to 1.7% on average per annum). Households and NPISH increased by 19.3% (equivalent to 1.0% on average per annum).
Table 2 shows that the economic downturn during 2008 and 2009 affected the growth of net capital stock to varying degrees by institutional sectors. Growth in net capital stock held by NFCs was adversely affected by the downturn, falling from 2.4% on average per annum in the pre-downturn decade to 0.6% in 2008 and 2009. In contrast, growth in net capital stock held by general government rose during the downturn to 4.8% on average per annum, returning to a level just below its pre-downturn trend rate in the following years at 2.5%.
Table 2: Average annual growth in net capital stocks by institutional sector
| Reference year: 2012 Coverage: United Kingdom | ||||
| Chained volume measures (%) | 1998 - 2007 | 2008 - 2009 | 2010 - 2014 | 1998 - 2014 |
| Non-financial corporations | 2.4% | 0.6% | 1.1% | 1.8% |
| Households and NPISH1 | 1.6% | 0.5% | 0.2% | 1.0% |
| General Government | 2.8% | 4.8% | 2.5% | 2.9% |
| Financial corporations | 2.4% | 0.4% | 0.9% | 1.7% |
| Total net capital stock | 2.2% | 1.2% | 1.0% | 1.7% |
| Source: Office for National Statistics | ||||
| Notes: | ||||
| 1. NPISH stands for non-profit institutions serving households, such as universities and charities. | ||||
Download this table Table 2: Average annual growth in net capital stocks by institutional sector
.xls (33.8 kB)Figure 7 highlights the contribution that each institutional sector made to annual net capital stock growth between 1998 and 2014. It shows that during the downturn, a strong rise in general government net capital stock growth partially offset slower net stock growth for households, NFCs and financial corporations, which accounted for a relatively higher share of the total stock over the 1997 to 2014 period. Due to methodological improvements made in this release, the deflators were re-aligned to those consistent with the latest in GFCF. This improvement to the deflator resulted in negative growth to general government in 2013. The increase in current prices (CP) was not enough to outweigh the decrease of the price effect at CVM.
Figure 7: Contributions to annual net stock growth by institutional sector
Reference year: 2012 Coverage: United Kingdom
Source: Office for National Statistics
Notes:
- NPISH stands for non-profit institutions serving households, such as universities and charities.
Download this chart Figure 7: Contributions to annual net stock growth by institutional sector
Image .csv .xls8. Analysis by type of asset
Net capital stocks were estimated at £4.1 trillion at the end of 2014. Since 1997, estimates of net capital stocks increased by £1.0 trillion. Figure 8 shows ‘dwellings’ accounted for the largest share of assets in 2014, at £1.7 trillion (42.1%) of the total net capital stocks in 2014. ‘Other buildings and structures’ accounted for the second largest share, £1.4 trillion (34.2%), while ‘Information and Communications Technologies (ICT), other machinery, equipment and weapons systems’, ‘intellectual property products’, and ‘transport equipment’ followed with £0.7 trillion (16.3%), £0.2 trillion (4.8%) and £0.1 trillion (2.4%) respectively.
During the period 1997 to 2014, the asset ‘ICT, other machinery, equipment and weapons systems’ experienced the strongest growth, increasing by 51.2% (2.5% per annum), followed by ‘intellectual property products’ which increased by 37.4% (1.9% per annum).
By comparing net stocks with consumption of fixed capital, the data suggest that there may be proportionally more investment in assets with a shorter life-length (thus having a faster rate of depreciation) and hence the rate of depreciation is increasing. The consumption of fixed capital for the asset ‘intellectual property products’ increased by 66.2% and grew by 3.0% on average per annum. Within this asset, the largest average contribution to annual growth came from ‘software and databases’ at 6.3% on average per annum, followed by ‘research and development’ at 1.5%. The assets ‘software and databases’ and ‘research and development’ contain some of the shortest asset life-lengths, at 5 years for ‘software and databases’ and between 4 and 12 years for ‘research and development’ (206.7 Kb Pdf). ‘ICT, other machinery, equipment and weapons systems’ increased by 66.2% between 1997 and 2014, equivalent to 3.0% on average per annum. ‘Other machinery, equipment and weapons systems’ asset has a life-length of between 10 to 30 years depending on its industry and ‘ICT’ asset has a life-length of between 4 and 12 years.
Figure 8: Net capital stocks estimates by asset, 1997 and 2014
Reference year: 2012 Coverage: United Kingdom
Source: Office for National Statistics
Download this chart Figure 8: Net capital stocks estimates by asset, 1997 and 2014
Image .csv .xlsTable 3 shows the economic downturn between 2008 and 2009 affected the pace of net capital stock accumulation by varying amounts across the assets. The asset ‘dwellings’ experienced the weakest average annual growth at 0.6% following the economic downturn. The average annual growth rate of ‘intellectual property products’ fell from 2.9% pre-downturn to a fall of 0.3% in the downturn period, post-downturn growth remained subdued at 0.8%. Growth in ‘ICT, other machinery, equipment and weapons systems’ fell from 3.7% in the pre-downturn decade to a decrease of 0.1% during the downturn and returned to growth of 1.1% post-downturn.
Table 3: Average annual growth in net capital stock by asset
| Reference year: 2012 Coverage: United Kingdom | ||||
| Chained volume measures (%) | 1998 - 2007 | 2008 - 2009 | 2010 - 2014 | 1998 - 2014 |
| Dwellings | 1.9% | 0.7% | 0.6% | 1.4% |
| Other buildings and structures | 1.7% | 2.7% | 1.4% | 1.7% |
| ICT, other machinery, equipment and weapons systems | 3.7% | -0.1% | 1.1% | 2.5% |
| Intellectual property products | 2.9% | -0.3% | 0.8% | 1.9% |
| Transport equipment | 1.3% | -0.5% | 1.3% | 1.1% |
| Cultivated biological resources | -0.8% | 9.3% | 3.7% | 1.6% |
| Total net capital stock | 2.2% | 1.2% | 1.0% | 1.7% |
| Source: Office for National Statistics | ||||
Download this table Table 3: Average annual growth in net capital stock by asset
.xls (32.8 kB)Figure 9 presents annual net capital stock growth between 1998 and 2014, according to the contribution to growth made from the headline assets (Table 3). The largest contributions to net capital stock growth between 1997 and 2014 came from ‘other buildings and structures’ and ‘dwellings’. This reflected the strong growth of the ‘other buildings and structures’ asset and the large share of ‘dwellings’. During the economic downturn, ‘other buildings and structures’ continued to make positive contributions to annual growth, while the contributions from ‘other machinery, equipment and weapons systems’ and ‘dwellings’ decreased and has remained low since. Due to methodological improvements made in this release, deflators were re-aligned to those consistent with the latest in GFCF. This change to the deflator for ‘other buildings and structures’ caused its contribution to growth in 2013 to be negative. The increase in current prices (CP) was not enough to outweigh the decrease of the price effect at CVM.
Figure 9: Contributions to annual net stock growth by asset
Reference year: 2012 Coverage: United Kingdom
Source: Office for National Statistics
Download this chart Figure 9: Contributions to annual net stock growth by asset
Image .csv .xls9. Analysis by industry
Estimates of capital stocks and the consumption of fixed capital can be analysed by industry using the UK Standard Industrial Classification 2007.
The share of the net capital stock held by the 4 broad industry groupings (other production; manufacturing; construction and services) reflects the relative shares of these industries in Gross Value Added (GVA) terms. Table 4 shows that the services industries (sections G to T) held an estimated £3.1 trillion (77.4%) of total net capital stocks at the end of 2014. Other production industries (sections A, B, D and E) held £332 billion (8.2%); construction (section F) £339 billion (8.3%), and manufacturing (section C) £246 billion (6.1%).
Over time, the percentage share of these industry groupings has been relatively stable. Services industries increased their percentage shares by 2.7% since 1997, while the ‘manufacturing’ and ‘other production’ have reduced their percentage share by 2.2% and 0.1% respectively (Figure 10).
Table 4: Volume and percentage of net capital stocks held by broad industry groups, 1997 to 2014
| Reference year: 2012 Coverage: United Kingdom | ||||||
| Chained volume measures1 | 1997 | 2014 | Change between 1997 and 2014 | |||
| Net capital stocks (£bn) | Share of assets held (%) | Net capital stocks (£bn) | Share of assets held (%) | Net captial stocks (£bn) | Share of assets held (%) | |
| ABDE Other production | 252 | 8.2 | 332 | 8.2 | 80 | -0.1 |
| C Manufacturing | 254 | 8.3 | 246 | 6.1 | -7 | -2.2 |
| F Construction | 254 | 8.3 | 339 | 8.3 | 85 | 0.0 |
| G to T Services | 2,280 | 74.7 | 3,145 | 77.4 | 865 | 2.7 |
| A-T Total | 3,052 | 100.0 | 4,061 | 100.0 | 1,010 | N/A |
| Source: Office for National Statistics | ||||||
| Notes: | ||||||
| 1. Totals may not sum due to rounding. | ||||||
Download this table Table 4: Volume and percentage of net capital stocks held by broad industry groups, 1997 to 2014
.xls (34.3 kB)
Figure 10: Net capital stocks by broad industry groups, 1997 to 2014
Reference year: 2012 Coverage: United Kingdom
Source: Office for National Statistics
Notes:
- Other production includes Agriculture, Mining & Quarrying, Utilities, Water Supply & Sewage.
Download this chart Figure 10: Net capital stocks by broad industry groups, 1997 to 2014
Image .csv .xlsIn current prices, the types of fixed assets held as stock varies across the industries of the economy in 2014 (Table 5). The services industries held the majority of their total net stocks in ‘dwellings’ (52%) and in ‘other buildings and structures’ (29%).
The construction industry held 72% of its assets in ‘other buildings and structures’ and 25% in ‘dwellings’. ‘Other production’ industries A,B,D,E held the majority of their total capital stocks as ‘other buildings and structures’ (65%) and ‘ICT, other machinery and equipment and weapons systems’ (29%).
In contrast, the manufacturing industry was the only industry group which held the majority of their capital stocks in ‘ICT, other machinery, equipment and weapons systems’ (53%), followed by ‘other buildings and structures’ (33%).
Table 5: Net capital stocks as a percentage of fixed assets held by asset and broad industry groups, 2014
| Reference year: 2012 Coverage: United Kingdom | |||||
| Current prices (%)1 | ABDE | C | F | G to T | A to T |
| Other production | Manufacturing | Construction | Services | Total | |
| ICT, other machinery, equipment and weapons systems | 29 | 53 | 3 | 13 | 16 |
| Transport equipment | 1 | 0 | 1 | 3 | 2 |
| Dwellings (excl land) | z | z | 25 | 52 | 42 |
| Other buildings and structures | 65 | 33 | 72 | 29 | 36 |
| Intellectual property products | 3 | 14 | 0 | 5 | 5 |
| Cultivated biological resources | 2 | z | z | z | 0 |
| Total fixed assets | 100 | 100 | 100 | 100 | 100 |
| Source: Office for National Statistics | |||||
| Notes: | |||||
| 1. Totals may not sum due to rounding | |||||
| 2. z denotes where data is not collected, not present or unavailable for an industry or asset. | |||||
Download this table Table 5: Net capital stocks as a percentage of fixed assets held by asset and broad industry groups, 2014
.xls (33.8 kB)The growth in net capital stock showed variation across the industries (Table 6). Net capital stocks held by manufacturing industries fell during the economic downturn, by 2.2% on average per annum in 2008 and 2009, before continuing to fall by 1.3% per annum between 2010 and 2014. In contrast, growth in the net capital stock held by ‘other production’ industries rose by 2.9% per annum during the downturn from 0.2% per annum in the pre-downturn decade and has risen further in the most recent years to 4.2%.
Table 6: Average annual growth in net capital stock by broad industry groups
| Reference year: 2012 Coverage: United Kingdom | |||||
| Chained volume measures (%) | 1998 - 2007 | 2008 - 2009 | 2010 - 2014 | 1998 - 2014 | |
| ABDE | Other production | 0.2% | 2.9% | 4.2% | 1.6% |
| C | Manufacturing | 0.8% | -2.2% | -1.3% | -0.2% |
| F | Construction | 2.0% | 3.1% | 0.5% | 1.7% |
| G to T | Services | 2.6% | 1.2% | 0.9% | 1.9% |
| A to T | Total net capital stock | 2.2% | 1.2% | 1.0% | 1.7% |
| Source: Office for National Statistics | |||||
Download this table Table 6: Average annual growth in net capital stock by broad industry groups
.xls (32.8 kB)Figure 11 shows that services industries consistently made the largest positive contribution to annual net capital stock growth between 1997 and 2014. The services industries hold the majority of their total net stocks as ‘dwellings’ (52%) and in ‘other buildings and structures’ (28%) which tend to be high value assets with longer life-lengths than other assets.
Figure 11: Contributions to annual net capital stock growth by industry
Reference year: 2012 Coverage: United Kingdom
Source: Office for National Statistics
Notes:
- Other production includes Agriculture, Mining & Quarrying, Utilities and Water Supply & Sewage.
Download this chart Figure 11: Contributions to annual net capital stock growth by industry
Image .csv .xls10. Capital output ratio analysis
The capital output ratio is calculated by dividing capital stocks estimates by gross value added (GVA), to obtain a measure of the capital intensity of each industry. GVA is the value of output less the value of intermediate consumption. Intermediate consumption consists of the value of those goods and services consumed as inputs by the process of production, excluding fixed assets whose consumption are recorded as the consumption of fixed capital.
All else being equal, if there is a higher level of capital stock in the economy, firms should theoretically be able to produce a greater quantity or quality of output using the same quantity of labour input. This higher level of productivity arises because workers have more or better tools or facilities at their disposal. Figure 12 shows that using this measure, the most ‘capital intensive’ industry in 2014 was real estate – holding the majority of assets in dwellings, though this interpretation should be used with caution. The output associated with owner-occupied dwellings has no labour input associated with it, and therefore is fully capital intensive.
The industries traditionally associated with infrastructure, such as ‘electricity, gas, steam and air conditioning supply’ are the most capital intensive excluding ‘real estate activities’. This fits in with prior expectations, as the majority of assets are buildings and heavy machinery in these industries, which are typically highly valuable and long lived. In contrast, service and high tech industries, such as ‘professional, scientific and technical activities’, are below average on this measure. Due to their nature, these industries typically require the intensive use of labour relatively more than capital, and as such, they surface as less capital intensive than the ‘heavy’ industries.
Figure 12: Capital intensity by industry sector (net stock in 2014 divided by the level of GVA in 2014)
Reference year: 2012 Coverage: United Kingdom

Source: Office for National Statistics
Download this image Figure 12: Capital intensity by industry sector (net stock in 2014 divided by the level of GVA in 2014)
.png (38.4 kB) .xls (28.2 kB)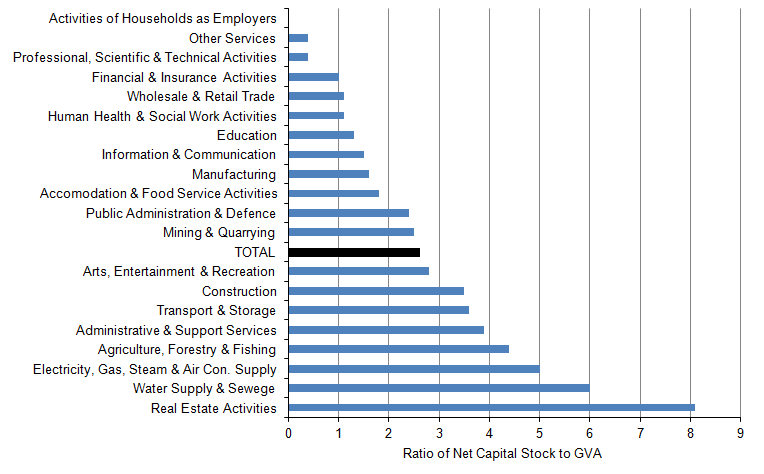
Figure 13 shows that industries have different net capital stock to output ratios over time. It indexes ratios for broad industry groupings to 2010=100. An increase in the line shows that the ratio has increased, and relates to either a decrease in GVA or an increase in net capital stocks. The economic downturn has proved a mixed picture for all industries. Construction saw a spike in 2012, given both an increase in net capital stocks and a noticeably large decrease in GVA. The general trend since the economic downturn is a steady decline in the net capital stock to GVA ratio. It is evident that manufacturing was hit hardest by the downturn, peaking in 2009.
Figure 13: Net capital stock output ratios, 1997 to 2014
Source: Office for National Statistics
Download this chart Figure 13: Net capital stock output ratios, 1997 to 2014
Image .csv .xls11. Net capital stocks per employee
It is possible to analyse the level of capital stock per employee. Net capital stocks are used in this calculation because they provide a better estimate of the value of capital stocks at a point in time compared with gross capital stocks. Estimates of employees are taken from our Labour Market Statistics publication.
Figure 14: Growth in net capital stock per employee, 1997 to 2014
Reference year: 2012 Coverage: United Kingdom
Source: Office for National Statistics
Download this chart Figure 14: Growth in net capital stock per employee, 1997 to 2014
Image .csv .xlsFigure 14 shows the annual growth in net capital stock per employee for the period 1998 to 2014. The sharp rise identified between 2007 and 2009 came as a result of a sudden fall in employees in order to offset the slowing growth in capital stocks during this period. The 3 periods of visible negative growth implies that businesses are beginning to shift their resources away from capital and more towards labour inputs.
The relationship between the number of workers and the size of the aggregate net capital stock grows steadily until 2008 (Figure 14). In 2009, the relationship spikes upwards in response to the sharp fall in employment which occurred over the early part of the economic downturn (Figure 15). As employment recovers in the years following 2009, the ratio stabilises and begins to fall as employment starts to grow from 2010, and subdued investment leads to lower than average growth to the aggregate capital stock.