
Table of contents
- Main points
- National Statistics re-assessment by the UK Statistics Authority
- What is services producer price inflation?
- Summary
- Annual inflation
- Quarterly inflation
- Economic context
- Net sector
- Quality and methodology
- Planned changes to methods for Producer Prices Index and Services Producer Prices Index
- Background notes
1. Main points
The price of services sold by UK companies, as estimated by the Services Producer Price Index (SPPI), increased 1.8% in the year to Quarter 3 (July to Sept) of 2016, compared with an increase of 1.5% in the year to Quarter 2 (Apr to June) of 2016.
Between Quarters 2 and 3 of 2016, SPPI rose by 0.4%, compared with an increase of 0.6% between Quarters 1 (Jan to Mar) and 2 of 2016.
Information and communication activities showed the largest upward contribution to the annual and quarterly rates. Prices increased by 3.2% in the year to Quarter 3 of 2016 and 0.5% between Quarters 2 and 3 of 2016.
Water supply, sewerage and waste management services showed the only downward contribution to the annual rate, decreasing by 1.5% in the year to Quarter 3 of 2016.
Back to table of contents3. What is services producer price inflation?
The Services Producer Price Indices (SPPI) provides a measure of inflation for the UK service sector. It is constructed from a statutory quarterly survey which measures changes in the price received for selected services provided by UK businesses to other UK businesses and government. Individual SPPIs are available which provide information on price change for a selection of service industries. These individual price indices are also aggregated together to create a service industry SPPI with limited coverage (it does not provide full coverage of the “service sector”).
The primary use of the SPPI is as a deflator in the UK National Accounts. However, it is also important as an inflationary measure to inform monetary policy and to account for inflation in long-term service procurement contracts. For more information on the use made of SPPI please see the separate document Users of Services Producer Price Index data.
The figures presented in this statistical bulletin are considered provisional for the latest 2 quarters (Quarters 2 and 3 of 2016) and may be revised as late data is received.
None of the indices presented in this bulletin are seasonally adjusted.
Coverage of SPPI
The service sector is estimated to account for around 78% of the UK economy based on its weight in gross domestic product (GDP). We do not produce an index for every industry in the service sector and so the SPPI is a partial, best estimate, of the overall inflation to UK businesses in the service sector. The SPPIs presented in this statistical bulletin are estimated to represent 59% of the total service sector at industry level. The SPPI's coverage of the service sector at standard industrial classification (SIC) class, division and section level is available in the SPPI coverage document. As resources allow, we will continue to review the existing indices and expand coverage through developing indices for new industries. As such, the SPPI will change composition from time to time but will always remain our best estimate of inflation in the UK service sector. The fact that coverage may change over time should be considered when deciding which indices best meet your needs.
Back to table of contents4. Summary
Between early-2006 and mid-2008, the annual rate of inflation in the service sector, as estimated by the Services Producer Price Index (SPPI), rose steadily from an annual rate of 2.4% in Quarter 1 (Jan to Mar) of 2006 to a peak of 3.7% during Quarters 1 and 2 (Apr to June) of 2008. At the end of 2008, the rate of inflation fell rapidly, from annual inflation of 3.6% in Quarter 3 (July to Sept) of 2008 to deflation (prices lower than they were in the same quarter of the previous year) of 1.6% in Quarter 3 of 2009.
The annual rate of inflation began to move in an upward direction at the end of 2009, reaching a post-economic downturn high of 1.8% in Quarter 2 of 2010. In the year to Quarter 3 of 2016, prices increased by 1.8%, which is the largest increase seen since Quarter 2 of 2010 (Figure 1).
Looking at the latest estimates (Table 1) of the SPPI for Quarter 3 of 2016, the main movements were:
prices received by UK service providers increased 1.8% in the year to Quarter 3 of 2016, up from an increase of 1.5% in the year to Quarter 2 of 2016
the main upward contributions to the annual rate came from increases in the prices charged for information and communication, and professional, scientific and technical activities
services prices rose 0.4% between Quarters 2 and 3 of 2016, compared with an increase of 0.6% between Quarters 1 and 2 of 2016
the main upward contributions to the quarterly rate of inflation came from information and communication, accommodation and food service activities and transportation and storage activities
Table 1: Output prices (gross sector) - Services Producer Price Index1,2,3
| Quarter 1 (Jan to Mar) 2012 to Quarter 3 (Jul to Sep) 2016, UK | Percentage change | |||
| Year | Quarter | |||
|---|---|---|---|---|
| 2012 | Q1 | 1.3 | 0.4 | |
| Q2 | 0.8 | 0.5 | ||
| Q3 | 1.5 | 0.2 | ||
| Q4 | 1.5 | 0.4 | ||
| 2013 | Q1 | 1.5 | 0.4 | |
| Q2 | 0.8 | -0.2 | ||
| Q3 | 0.8 | 0.2 | ||
| Q4 | 1.3 | 0.9 | ||
| 2014 | Q1 | 0.9 | 0.0 | |
| Q2 | 1.5 | 0.4 | ||
| Q3 | 1.5 | 0.2 | ||
| Q4 | 0.6 | 0.0 | ||
| 2015 | Q1 | 0.4 | -0.2 | |
| Q2 | 0.4 | 0.4 | ||
| Q3 | 0.3 | 0.1 | ||
| Q4 | 0.7 | 0.4 | ||
| 2016 | Q1 | 1.3 | 0.5 | |
| Q2 | 1.5 | 0.6 | ||
| Q3 | 1.8 | 0.4 | ||
| Source: Services Producer Price Indicies (SPPI) - Office for National Statistics | ||||
| Notes: | ||||
| 1. The SPPI is calculated on a gross sector basis. | ||||
| 2. The SPPI is an aggregate of the individual industry level SPPIs (excluding Financial Intermediation) published in the SPPI Statistical Bulletin. It does not provide full coverage of the service sector. | ||||
| 3. Q1 refers to Quarter 1 (January to March), Q2 refers to Quarter 2 (April to June), Q3 refers to Quarter 3 (July to September) and Q4 refers to Quarter 4 (October to December). | ||||
Download this table Table 1: Output prices (gross sector) - Services Producer Price Index^1,2,3^
.xls (26.6 kB)
Figure 1: Services Producer Price Index1,2,3
Quarter 3 (July to Sept) 2006 to Quarter 3 (July to Sept) 2016, UK
Source: Services Producer Price Indices (SPPI) - Office for National Statistics
Notes:
- The SPPI is calculated on a gross sector basis.
- The SPPI is an aggregate of the individual industry level SPPIs (excluding financial intermediation) published in the SPPI statistical bulletin. It does not provide full coverage of the service sector.
- Q1 refers to Quarter 1 (January to March), Q2 refers to Quarter 2 (April to June), Q3 refers to Quarter 3 (July to September) and Q4 refers to Quarter 4 (October to December).
Download this chart Figure 1: Services Producer Price Index^1,2,3^
Image .csv .xls5. Annual inflation
The Services Producer Price Index (SPPI) rose by 1.8% in the year to Quarter 3 (July to Sept) of 2016, up from an increase of 1.5% in the year to Quarter 2 (Apr to June) of 2016. Of the 10 sections (as defined by the 2007 Standard Industrial Classification) that are combined to form the SPPI, 9 showed price increases.
The main upward contributions to the annual rate of the SPPI came from information and communication, and professional, scientific and technical activities. These increased 3.2% and 2.0% respectively, in the year to Quarter 3 of 2016, compared with increases of 3.3% and 1.8% in the year to Quarter 2 of 2016. Transportation and storage activities also had a notable contribution to the increase of the index in the year to Quarter 3 of 2016, increasing by 1.0%, up from 0.8% in the year to Quarter 2 of 2016.
The only section to show a decrease was water supply, sewerage and waste management services where prices fell by 1.5% in the year to Quarter 3 of 2016, compared with a decrease of 3.9% in the year to Quarter 2 of 2016 (Table 2 and Figure 2).
Table 2: Annual growth in Services Producer Price Index (percentage change, latest quarter on corresponding quarter of previous year)1
| Quarter 3 (Jul to Sep) 2016, UK | |
| Section | Annual percentage change |
|---|---|
| Water supply, sewerage and waste management | -1.5 |
| Repair and maintenance of motor vehicles | 1.5 |
| Transportation and storage | 1.0 |
| Accommodation and food | 1.9 |
| Information and communication | 3.2 |
| Real estate activities | 2.8 |
| Professional, scientific and technical activities | 2.0 |
| Administrative and support services | 0.8 |
| Education | 0.8 |
| Other services | 2.8 |
| SPPI | 1.8 |
| Source: Services Producer Price Indicies (SPPI) - Office for National Statistics | |
| Notes: | |
| 1. The section level SPPIs are an aggregate of individual industry level SPPIs (excluding Financial Intermediation) published in the SPPI Statistical Bulletin. They do not provide full coverage of the service sector. | |
Download this table Table 2: Annual growth in Services Producer Price Index (percentage change, latest quarter on corresponding quarter of previous year)^1^
.xls (25.6 kB)
Figure 2: Contribution to Services Producer Price Index annual growth rate1
Quarter 3 (July to Sept) 2016, UK
Source: Services Producer Price Indices (SPPI) - Office for National Statistics
Notes:
- The section level SPPIs are an aggregate of individual industry level SPPIs (excluding financial intermediation) published in the SPPI statistical bulletin. They do not provide full coverage of the service sector.
Download this chart Figure 2: Contribution to Services Producer Price Index annual growth rate^1^
Image .csv .xlsInformation and communication activities prices increased by 3.2% in the year to Quarter 3 of 2016. Prices rose in all indices within this section, but the largest contributions to the rise were seen in business telecoms and computer software. Business telecoms prices increased by 5.7% in the year to Quarter 3 of 2016, compared with an increase of 7.7% in the year to Quarter 2 of 2016. Computer software services increased 2.0% in the year to Quarter 3 of 2016, compared with an increase of 1.5% in the year to Quarter 2 of 2016. This increase is due to a rise in the price of maintenance and support of software systems and applications.
Professional, scientific and technical activities prices increased 2.0% in the year to Quarter 3 of 2016. Increases in the prices of accountancy services, business and management consultancy services and legal services contributed towards this increase, with prices increasing 4.1%, 1.7% and 3.5% respectively in the year to Quarter 3 of 2016. The increase in the price for accountancy services was due to a rise in the prices for auditing and assurance, that for business and management consultancy services was caused by human resources consultancy and the increase for legal services resulted from price rises in legal advisory and representation for business and commercial.
Transportation and storage activities also showed a notable increase in the year to Quarter 3 of 2016, with prices rising by 1.0%. Business airfares and courier services provided the biggest contributions to the increase. Business airfares increased 3.9% in the year to Quarter 3 of 2016, compared with an increase of 1.3% in the year to Quarter 2 of 2016. Courier services prices increased 2.9% in the year to Quarter 3 of 2016, compared with an increase of 3.0% in the year to Quarter 2 of 2016.
Water supply, sewerage and waste management services showed the only downward contribution within the SPPI. Prices fell 1.5% in the year to Quarter 3 of 2016, compared with a fall of 3.9% in the year to Quarter 2 of 2016. This decrease was largely a result of the fall in prices for sorted recovered materials services, where prices fell 6.5% in the year to Quarter 3 of 2016, up from a decrease of 15.6% in the year to Quarter 2 of 2016 (Figure 3).
Figure 3: Services Producer Price Index for sorted recovered materials services1
Quarter 3 (July to Sept) 2011 to Quarter 3 (July to Sept) 2016, UK
Source: Services Producer Price Indices (SPPI) - Office for National Statistics
Notes:
- Q1 refers to Quarter 1 (January to March), Q2 refers to Quarter 2 (April to June), Q3 refers to Quarter 3 (July to September) and Q4 refers to Quarter 4 (October to December).
Download this chart Figure 3: Services Producer Price Index for sorted recovered materials services^1^
Image .csv .xlsThe SPPI increased 1.8% in the year to Quarter 3 of 2016, compared with an increase of 1.5% in the year to Quarter 2 of 2016. Figure 4 shows how the SPPI sections have contributed towards this 0.3 percentage point change.
Increases in the prices of water supply, sewerage and waste, vehicle repair and maintenance, transportation and storage, accommodation and food, professional, scientific and technical and administrative and support services were offset by decreases in the prices of real estate activities, information and communication, and education services.
Figure 4: Contribution to the change in the 12-month growth rate between Quarter 2 (Apr to June) 2016 and Quarter 3 (July to Sept) 2016
UK
Source: Services Producer Price Indices (SPPI) - Office for National Statistics
Notes:
- The section level SPPIs are an aggregate of individual industry level SPPIs (excluding financial intermediation) published in the SPPI statistical bulletin. They do not provide full coverage of the service sector.
- Q1 refers to Quarter 1 (January to March), Q2 refers to Quarter 2 (April to June), Q3 refers to Quarter 3 (July to September) and Q4 refers to Quarter 4 (October to December).
Download this chart Figure 4: Contribution to the change in the 12-month growth rate between Quarter 2 (Apr to June) 2016 and Quarter 3 (July to Sept) 2016
Image .csv .xls
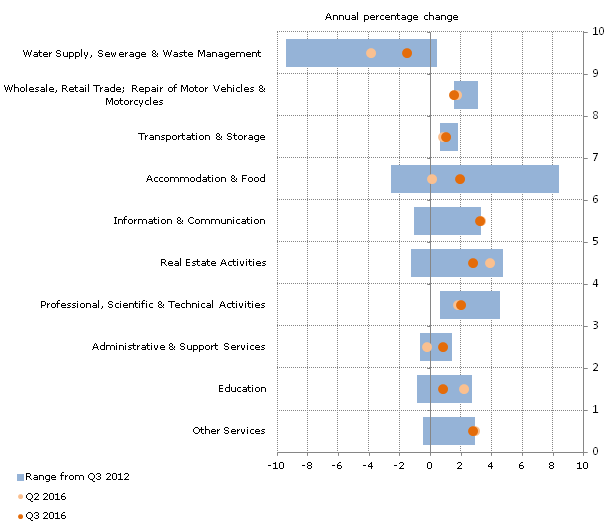
Figure 5: Services Producer Price Index by section
Quarter 3 (July to Sept) 2012 to Quarter 3 (July to Sept) 2016, UK
Source: Services Producer Price Indices (SPPI) - Office for National Statistics
Notes:
- Q1 refers to Quarter 1 (January to March), Q2 refers to Quarter 2 (April to June), Q3 refers to Quarter 3 (July to September) and Q4 refers to Quarter 4 (October to December).
Download this image Figure 5: Services Producer Price Index by section
.png (23.5 kB) .xls (29.2 kB)
Examining inflation for each of the sections that contribute to the SPPI reveals a diverse set of trends. Figure 5 shows both the range of annual inflation rates experienced by each of the sections since Quarter 3 of 2012 and the annual rates of inflation for the 2 most recent quarters.
One notable difference between each section is the range of inflation rates that have been experienced since 2012. Water supply, sewerage and waste management services, accommodation and food, and real estate activities have experienced a relatively wide range of inflation rates over this period. Although all sections have experienced some variance in inflation, certain industries have experienced inflation consistently higher than others. Wholesale and retail trade, vehicle repair and maintenance has not experienced inflation lower than 1.5% at any point in the past 5 years, while administrative and support services has not experienced inflation higher than 1.4%.
Back to table of contents6. Quarterly inflation
Prices received for the services included in the Services Producer Price Index (SPPI) rose 0.4% between Quarters 2 (Apr to June) and 3 (July to Sept) of 2016, compared with an increase of 0.6% between Quarters 1 (Jan to Mar) and 2 of 2016. Of the 10 sections that make up the SPPI, 6 showed increases in prices between Quarter 2 and 3 of 2016.
The largest increase in the quarterly rate came from accommodation and food services, which increased by 1.7% between Quarters 2 and 3 of 2016. The remaining increases were small, ranging from 0.1% to 0.5% (Table 3).
Table 3: Quarterly growth in Services Producer Price Index (percentage change, latest quarter on previous quarter)1
| Quarter 3 (Jul to Sep) 2016, UK | |
| Section | Quarterly percentage change |
|---|---|
| Water supply, sewerage and waste management | 0.2 |
| Repair and maintenance of motor vehicles | 0.1 |
| Transportation and storage | 0.4 |
| Accommodation and food | 1.7 |
| Information and communication | 0.5 |
| Real estate activities | 0.0 |
| Professional, scientific and technical activities | 0.0 |
| Administrative and support services | 0.1 |
| Education | -0.4 |
| Other services | 0.0 |
| SPPI | 0.4 |
| Source: Services Producer Price Indicies (SPPI) - Office for National Statistics | |
| Notes: | |
| 1. The section level SPPIs are an aggregate of individual industry level SPPIs (excluding Financial Intermediation) published in the SPPI Statistical Bulletin. They do not provide full coverage of the service sector. | |
Download this table Table 3: Quarterly growth in Services Producer Price Index (percentage change, latest quarter on previous quarter)^1^
.xls (25.1 kB)
Figure 6: Contribution to Services Producer Price Index quarterly growth1
Quarter 3 (July to Sept) 2016, UK
Source: Services Producer Price Indices (SPPI) - Office for National Statistics
Notes:
- The section-level SPPIs are an aggregate of the individual industry-level SPPIs (excluding financial intermediation) published in the SPPI statistical bulletin. They do not provide full coverage of the section listed.
Download this chart Figure 6: Contribution to Services Producer Price Index quarterly growth^1^
Image .csv .xlsInformation and communication services activities showed the largest contribution to the SPPI rate between Quarters 2 and 3 of 2016, with prices rising by 0.5%, compared with an increase of 1.9% between Quarters 1 and 2 of 2016. The main contributions to this increase were from computer software prices and book publishing services, which increased by 0.8% and 0.4%, respectively, between Quarters 2 and 3 of 2016. The movement in computer software prices was driven by maintenance and support of software systems and applications. The increase in the prices of book publishing services was driven by printed general interest journals and periodicals.
Back to table of contents7. Economic context
Comparison with average weekly earnings
The Services Producer Price Index (SPPI) captures changes in the prices charged by UK business for the provision of a selection of services to other UK businesses and the public sector. For many services, the cost of labour is the largest component of the price charged by businesses for providing the service, rather than the cost of goods or fuels. As a result, a change in the wage structure of the workforce can have an important impact on the SPPI. It is expected that the price charged for services should move in a similar way to the wages received by the UK workforce.
Figure 7 shows the annual percentage change of the fees received by UK businesses for the provision of services, as estimated by the SPPI, with an indicator of salaries received by the UK workforce who are employed in the service sector, as estimated by the average weekly earnings (AWE) “services” pay index (excluding bonuses).
Figure 7: Comparison of Services Producer Price Index and ''service'' Average Weekly Earnings Index1,2,3
Quarter 3 (July to Sept) 2003 to Quarter 3 (July to Sept) 2016, UK
Source: Services Producer Price Indices (SPPI) and Annual Weekly Earnings (AWE) - Office for National Statistics
Notes:
- The SPPI includes the water supply; sewerage and waste management sector not included in the AWE.
- The AWE index includes financial and insurance activities, public administration and defence: compulsory social security, human health and social work activities and arts, entertainment and recreation sectors not included in the SPPI.
- Q1 refers to Quarter 1 (January to March), Q2 refers to Quarter 2 (April to June), Q3 refers to Quarter 3 (July to September) and Q4 refers to Quarter 4 (October to December).
Download this chart Figure 7: Comparison of Services Producer Price Index and ''service'' Average Weekly Earnings Index^1,2,3^
Image .csv .xlsFigure 7 shows the growth rates of both wages and services prices slowed considerably during 2008 and 2009, with services inflation falling from a four-quarter average of 3.5% in 2008 to minus 0.8% in 2009, while growth in services wages slowed from 3.9% to 1.9% on a four-quarter average during the same period. Following the downturn, services prices and wages have followed similar trends, diverging slightly during 2015, as wages grew faster than services prices from the end of 2014. Looking at the most recent data, while services wages continue to grow faster than services prices in 2016, the gap between both indicators have narrowed compared to 2015. In the year to Quarter 3 (July to September) 2016, services wages had grown by 2.3%, compared to services prices, which had grown by 1.8% over the same period.
The convergence between services wages and services price growth could be partly attributed to the introduction of the national living wage. According to Market/CIPS UK Services report, the increase in services prices in Quarter 3 (August to September) 2016 could be partly explained by the increase in salaries, alongside other factors, which is putting an upward pressure on services costs.
Alongside the introduction of the national living wage, the rise in the services industry wage growth could also reflect the wider tightening in the UK labour market. The unemployment rate amongst those aged 16 and over fell to 4.8% in the 3 months to September 2016, compared to 4.9% in the three months to June 2016, while the employment rate amongst those aged 16 to 64 remained steady at 74.5% over the same period. Labour demand – as measured by the number of vacancies – has been relatively strong. The number of unemployed people per vacancy has been on a downward trend since 2011, falling from 5.8 in the three months to December 2011 to 2.1 in the 3 months to September 2016, indicating that there are fewer unemployed workers for each vacancy. In relation to the services industry, the number of vacancies has been rising since mid-2012 and increased by 2.1% in the three months to September 2016, compared with a year earlier.
While the tightening labour market could be exerting upward pressure on wages, the productivity of labour could also be influencing services price growth. Improvements in productivity creates capacity for output to rise faster than the corresponding rise in inputs, thereby allowing firms to produce more output per unit of labour employed and, all else equal, leading to lower unit labour costs. However, services productivity growth has remained broadly constant since Quarter 3 (July to September) 2014, increasing by 1.1% in the year to Quarter 2 (April to June) 2016, while services wages increased by 2.0% over the same period. This means that the unit labour costs in the service sector - the labour cost per unit of output produced – increased by 1.9% in Quarter 2 (April to May) 2016.
However, although labour cost is a significant factor determining services output prices, competitive pressures will also have some bearing on services prices, which could be limiting the extent to which businesses can pass on those increasing labour costs.
Comparison with Consumer Prices Index
While the SPPI measures the amount received by a company for services they’ve provided to other businesses, the prices paid by households is estimated by the Consumer Prices Index (CPI). While the costs associated with providing services to both businesses and households will be broadly similar, there may be different costs associated with providing services to different customers. Figure 8 shows a comparison with the “all services” sector of the Consumer Prices Index (CPI), which measures the prices paid for services by households.
Figure 8: Comparison of Services Producer Price Index and 'all services' Consumer Price Index1,2,3,4
Quarter 3 (July to Sept) 2003 to Quarter 3 (July to Sept) 2016, UK
Source: Services Producer Price Indices (SPPI) and Consumer Price Index (CPI) - Office for National Statistics
Notes:
- SPPI measures changes in the price received by a company, CPI measures changes in the price paid by a consumer. Therefore CPI figures may include taxes and fees that are not retained by the service provider.
- SPPI measures the price received for services provided by UK based suppliers only, excluding imports from non-UK suppliers. CPI aims to measure the price paid by consumers in the UK, who may use non-UK based suppliers.
- SPPI uses standard industrial classification 2007 (SIC 07) to produce its aggregate, CPI uses classification of individual consumption according to purpose (COICOP). This means that the structure of each index may not always correlate at more detailed levels.
- Q1 refers to Quarter 1 (January to March), Q2 refers to Quarter 2 (April to June), Q3 refers to Quarter 3 (July to September) and Q4 refers to Quarter 4 (October to December).
Download this chart Figure 8: Comparison of Services Producer Price Index and 'all services' Consumer Price Index^1,2,3,4^
Image .csv .xlsGenerally inflation in the CPI “all services” index runs at a higher rate than the SPPI. Between late 2005 and 2008, the gap between the SPPI and CPI annual rates of inflation narrowed before widening again from 2009 to present. During the economic downturn in 2008 to 2009, the annual rates of inflation for both indices decreased, with prices falling by as much as 1.6% for services sold by UK businesses, while the prices paid by households continued to grow, although at a much lower rate, reaching a low of 2.3% in Quarter 4 (Oct to Dec) of 2009. Since Quarter 1 of 2010, both indices have shown growth; however, the SPPI has shown significantly lower growth than CPI.
Other measures of service sector inflation
There are other measures of service sector inflation available such as the Chartered Institute of Procurement and Supply (CIPS) Purchasing Managers’ Index and the Confederation of British Industry (CBI) Service Sector Survey. There are significant methodological differences between these surveys and SPPI; therefore, direct comparisons cannot be made.
International comparison
All countries within the European Union are required to produce a measure of producer price inflation for the services sector under the Short Term Statistics Regulation. Figure 9 shows the growth rates of services producer prices for a selection of EU countries from Quarter 2 (Apr to June) of 2011 to Quarter 2 of 2016; this is the latest comparable data available for most of the countries represented.
The UK recorded largely stable services producer price indices, growing by 1.3%1 in Quarter 2 of 2016. This contrasts with France and Spain. France experienced negative SPPI inflation until Quarter 2 of 2015 and has seen a rise of 0.4% in Quarter 2 of 2016, down from a rise of 0.7% in the previous quarter. Spain experienced negative SPPI inflation until Quarter 1 of 2015 and again in Quarter 1 and Quarter 2 of 2016. Austria and Sweden have both seen smaller rises in comparison with Quarter 1 of 2016, at 1.5% and 0.3% respectively.
Figure 9: Services Producer Price Index international comparison1,2
Quarter 2 (Apr to June) 2011 to Quarter 2 (Apr to June) 2016, UK and selected EU countries
Source: Eurostat
Notes:
- The UK growth in this chart does not match that published as the gross sector SPPI. This is because the indices shown in this comparison only include sections G to N, as per the standard industrial classification 2007 (SIC 07). The gross sector SPPI also includes industries classified to sections E and G of SIC 07. A full list of all SIC codes included can be found in the SPPI coverage document.
- Q1 refers to Quarter 1 (January to March), Q2 refers to Quarter 2 (April to June), Q3 refers to Quarter 3 (July to September) and Q4 refers to Quarter 4 (October to December).
Download this chart Figure 9: Services Producer Price Index international comparison^1,2^
Image .csv .xlsFrance and Spain experienced the lowest average inflation rates across the period between Quarter 2 2011 and Quarter 2 2016, with both countries witnessing falling prices for extended periods. More recently, France witnessed a rise in prices between Quarter 3 2015 and Quarter 2 2016 and Spain between Quarters 2 and 4 of 2015, although Spain then saw prices fall again in Quarter 1 2016. Austria experienced the highest average inflation rate across the period, ranging from a high of 2.6% in Quarter 4 of 2011 to a low of 0.9% in Quarter 3 of 2015.
Notes for Economic context:
- The UK growth in this chart does not match that published as the gross sector SPPI. This is because the indices shown in this comparison only include sections G to N, as per the standard industrial classification 2007 (SIC 07). The gross sector SPPI also includes industries classified to sections E and G of SIC 07. A full list of all SIC codes included can be found in the SPPI coverage document.
8. Net sector
At the aggregate level, both a net and gross sector Services Producer Price Index (SPPI) is produced. The prices used to construct both of these indices are the same, but different weights are used to construct the net sector index compared with the gross sector.
Summary of net sector movements
In Quarter 3 (July to Sept) of 2016, movements in the net sector SPPI were:
- annual inflation rose 1.7%, compared with a rise of 1.4% in the year to Quarter 2 (Apr to June) of 2016
- between Quarters 2 and 3 of 2016, quarterly inflation stood at 0.3%, compared with 0.5% between Quarters 1 (Jan to Mar) and 2 of 2016
Generally, the movements of the net sector SPPI are similar to those of the gross sector indices (Figure 10).
Figure 10: Services Producer Price Index (net and gross sectors)1,2
Quarter 3 (July to Sept) 2011 to Quarter 3 (July to Sept) 2016, UK
Source: Services Producer Price Indices (SPPI) - Office for National Statistics
Notes:
- The SPPI is an aggregate of the individual industry-level SPPIs (excluding Financial Intermediation) published in the SPPI statistical bulletin. It does not provide full coverage of the service sector.
- Q1 refers to Quarter 1 (January to March), Q2 refers to Quarter 2 (April to June), Q3 refers to Quarter 3 (July to September) and Q4 refers to Quarter 4 (October to December).
Download this chart Figure 10: Services Producer Price Index (net and gross sectors)^1,2^
Image .csv .xls9. Quality and methodology
The SPPI Quality and Methodology Information document contains important information on:
- the strengths and limitations of the data and how it compares with related data
- users and uses of the data
- how the output was created
- the quality of the output including the accuracy of the data
Detailed information on the methods used to compile the SPPI is available in the SPPI manual.
Back to table of contents10. Planned changes to methods for Producer Prices Index and Services Producer Prices Index
We will be publishing an article alongside the next Producer Prices Index (PPI) publication on 14 December 2016, notifying users of upcoming changes and improvements due to be delivered to Services Producer Prices Index (SPPI) and PPI (in particular exported outputs and imported inputs) throughout 2017/18.
Firstly, the Short Term Statistics (STS) regulation, under which the aforementioned statistics are currently published, will be replaced by the Framework Regulation Integrating Business Statistics (FRIBS). This is a European regulation aimed at ensuring EU member states report data on a common basis, but will also include important improvements which are vital for improving the UK National Accounts' (NA) ability to calculate economic measures; such as Gross Domestic Product (GDP). It will provide more complete measures of price change in the service sector, primarily by broadening the coverage from 'Business to Business' transactions to 'Business to All', and assist users, such as the Bank of England (BoE), in making assessments of and monitoring the UK economy which is essential for policy making. This change in regulation will come into force in 2019.
The second change will relate to the sample size of SPPI, exported output and imported inputs within PPI and selection methods of SPPI. The number of prices collected will be increased to 6,000 in each survey and the Services Turnover Survey will be used as a sampling frame for the SPPI. Furthermore, new methodology will be used to ensure efficient use of resource and optimum quality for the resources available.
The paper will detail the scheduled dates on which the changes will take place, as well as providing details on the nature of the changes. Users will also be invited to provide feedback and ask any questions regarding the changes.
Back to table of contents